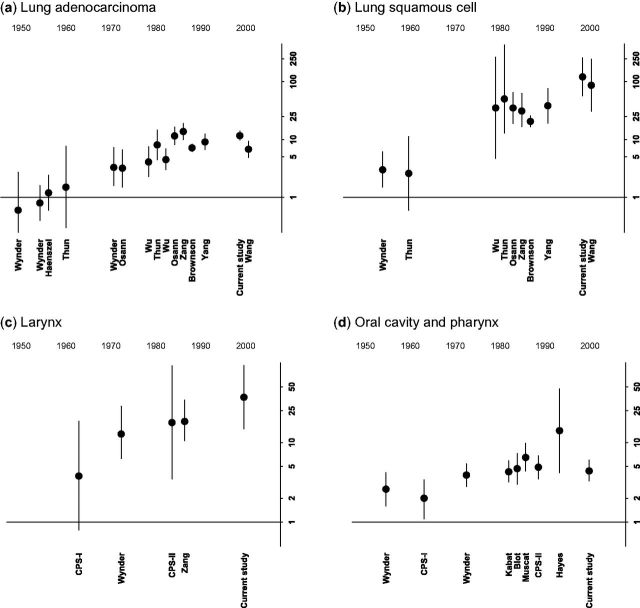
Figure 2.
Current cigarette use and lung and head and neck cancer by study year, in women. Relative risks for current vs never smoking are plotted on the y-axis, using a log scale. Year is on the x-axis. Plotted circles represent the point estimate and whiskers reflect the 95% confidence intervals. Each study is plotted by the mid point of when it was conducted, and labelled with the first author of the associated publication. Horizontal line represents a relative risk of 1. (a) Lung adenocarcinoma; (b) lung squamous cell carcinoma; (c) larynx; (d) oral cavity and pharynx.

