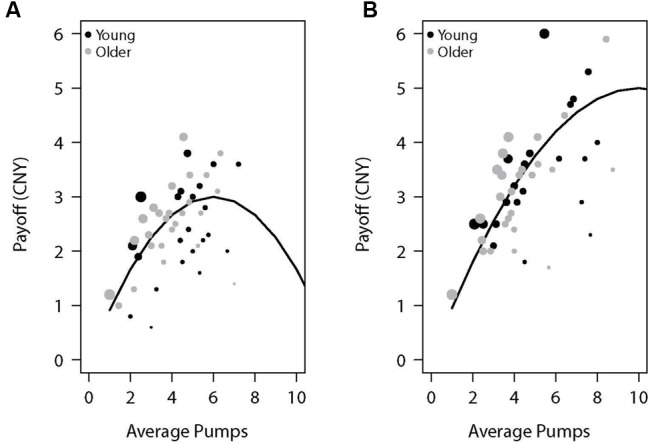
FIGURE 1.

Payoff as a function of average pumps for the (A) low-capacity and (B) high-capacity reward balloons. The lines represent the expected value of the specific average pumps across 10 trials of each balloon type (the average number of trials experienced by participants). Each dot represents a participant, with its diameter being a function of the proportion of cashout trials.
