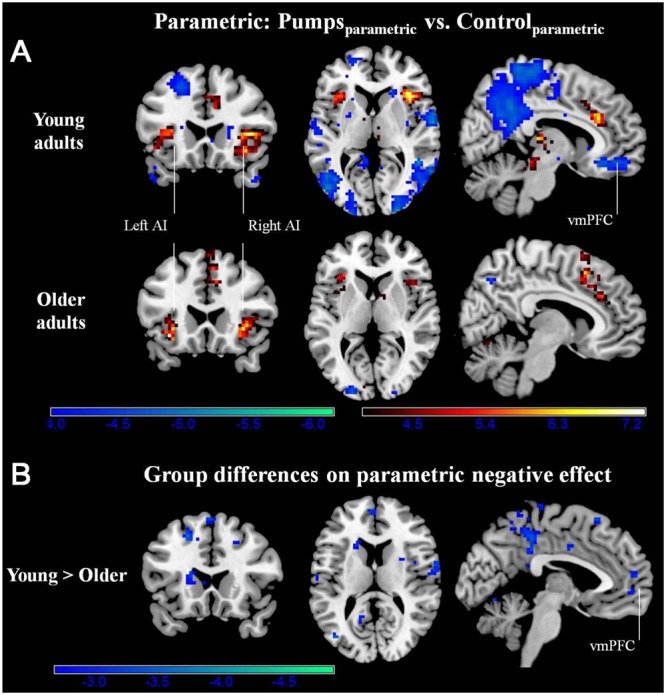
FIGURE 3.

(A) Parametric modulation of increasing number of pumps in the young and older age group. The red scale represents PumpsParametric > ControlParametric and the blue scale represents ControlParametric > PumpsParametric. p < 0.05, corrected. (B) Age group differences on parametric contrast. The blue scale represents neural regions in which young adults had more negative effect than older adults. p < 0.005, uncorrected (scale represents the range of t-values). No brain regions were discovered for (1) which older adults had larger negative effects relative to young adults or (2) age group differences on parametric positive effect at this threshold.
