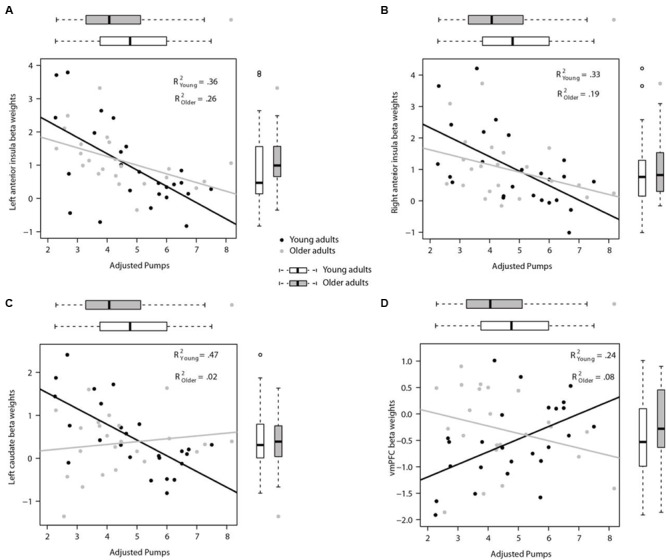
FIGURE 5.

Region of interest (ROI) analyses for links between individual neural and behavioral differences. (A) Participants’ mean adjusted pumps negatively correlated with their BOLD signals in the left AI and (B) the right AI for both young and older adults. (C) Activity in the left striatum was significantly correlated with mean adjusted pumps in young adults, but not in older adults. (D) Activity in the vmPFC was positively correlated with mean adjusted pumps in young adults, but not in older adults. The boxplots on top of the plot show the distribution of mean adjusted pumps in the young and older age group, respectively, whereas boxplots to the left of the plot show the distribution of the signal changes in the left/right AI, vmPFC and left striatum, respectively. ROIs were created as 4 mm radius spherical regions covering bilateral anterior insula and left striatum, and an 8 mm radius spherical region in the vmPFC (center coordinates based on meta-analysis by Bartra et al., 2013).
