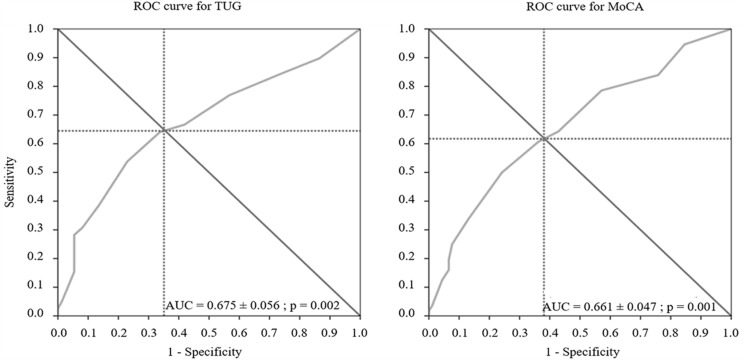
FIGURE 1.
Each point on the ROC curve corresponds to a specific cut-off, with each cut-off having its own sensitivity and specificity. The optimal cut-off is defined as the value, here that of the number of molecules, that provides the best combination of sensitivity and specificity. This optimal cut-off can be identified as the intersection of the ROC curve with the diagonal. The area under the curve (AUC) is equal to 1 for perfect discrimination and 0.5 for an uninformative cut-off point. The optimal cut-off value of the number of molecules was 4.5 for each ROC curve. MoCA, Montreal Cognitive Assessment; TUG, Timed Up and Go test.

