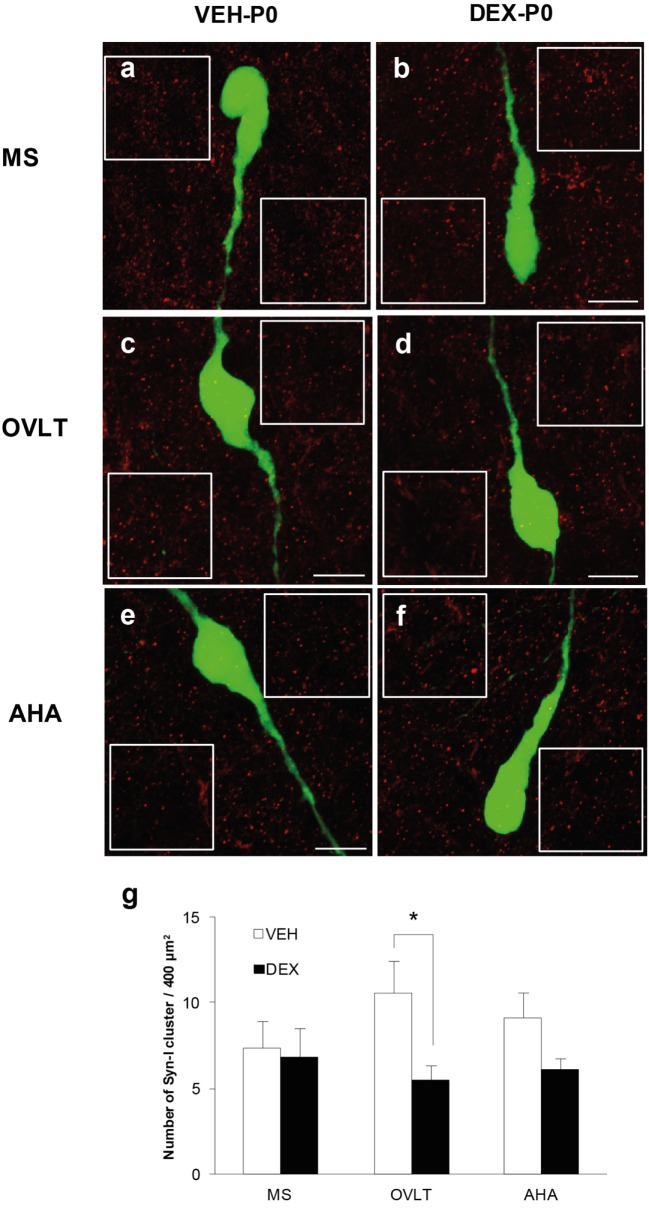
Figure 2.
Quantification of synapsin I-immunoreactive punctae cluster (syn I-ir, red) in areas adjacent to the EGFP–GnRH neurons (green). Representative photomicrographs for the quantification of average number of syn I-ir punctae from two 400 μm2 areas (white box) placed at both sides of each neuron, depending on each neuronal orientation in the image plane, for each VEH-P0 and DEX-P0 GnRH neurons analyzed in the MS (A,B), OVLT (C,D), and AHA (E,F). The average number of syn I-ir punctae cluster (G) was decreased in the OVLT region of DEX-P0 compared to the VEH-P0 males. Data are represented by the mean ± SEM for each group. *P < 0.05 compared to VEH-P0 group. Scale bar = 10 μm (A–F).

