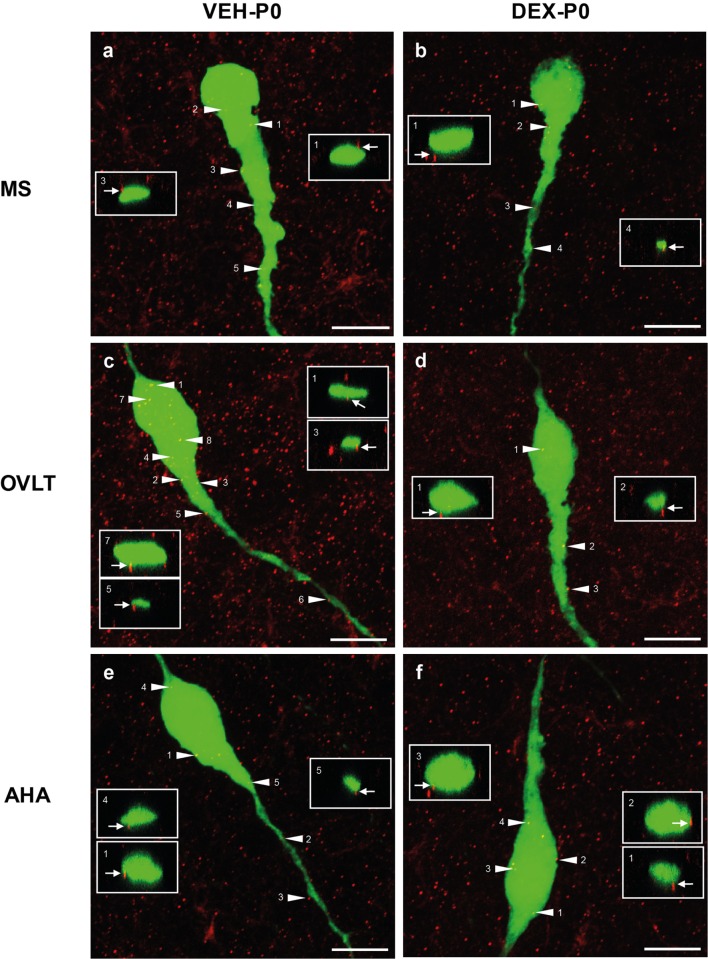
Figure 3.
Photomicrographs of syn I-ir punctae cluster (red) on the EGFP–GnRH (green) neuronal soma and primary dendrite of the VEH-P0 and DEX-P0 males in MS (A,B), OVLT (C,D), and AHA (E,F) region. Boxed region (white) of syn I-ir cluster was taken along the X–Z axis from the orthogonal view of single optical sections (0.2 μm) with specific syn I-ir inputs identified by the numbers (white arrowhead) to illustrate the close appositions of the syn I-ir punctae cluster (white arrow) on the EGFP–GnRH neurons. Scale bar = 10 μm (A–F).

