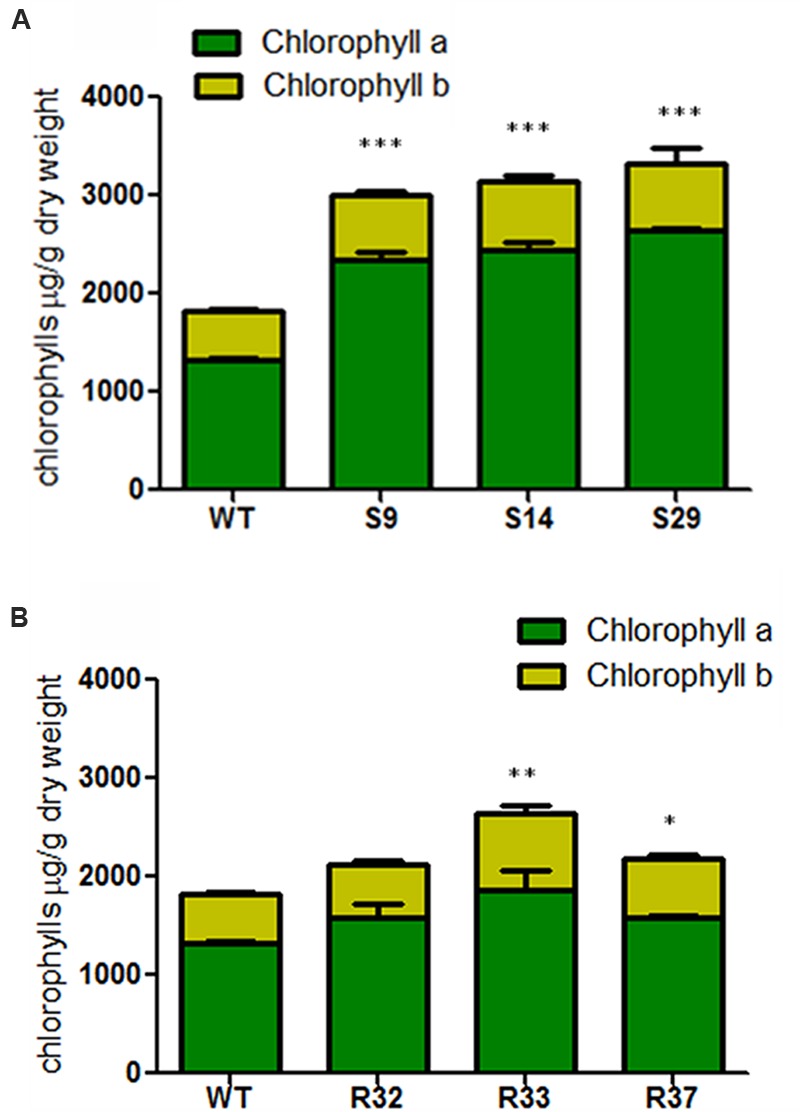
FIGURE 5.

Chlorophyll composition in leaves of carrot transgenic lines expressing AtDXS and AtDXR. (A) Quantification of chlorophyll a and chlorophyll b in leaves of three DXS transgenic lines, (B) Quantification of chlorophyll a and chlorophyll b in leaves of three DXR transgenic lines. The sum of both chlorophyll a and chlorophyll b represents the total chlorophylls in wild-type (WT), and transgenic lines, Asterisks indicate significant differences between transgenic lines and wt determined two-tailed unpaired Student’s t-test. ∗p < 0.05; ∗∗p < 0.01; ∗∗∗p < 0.001.
