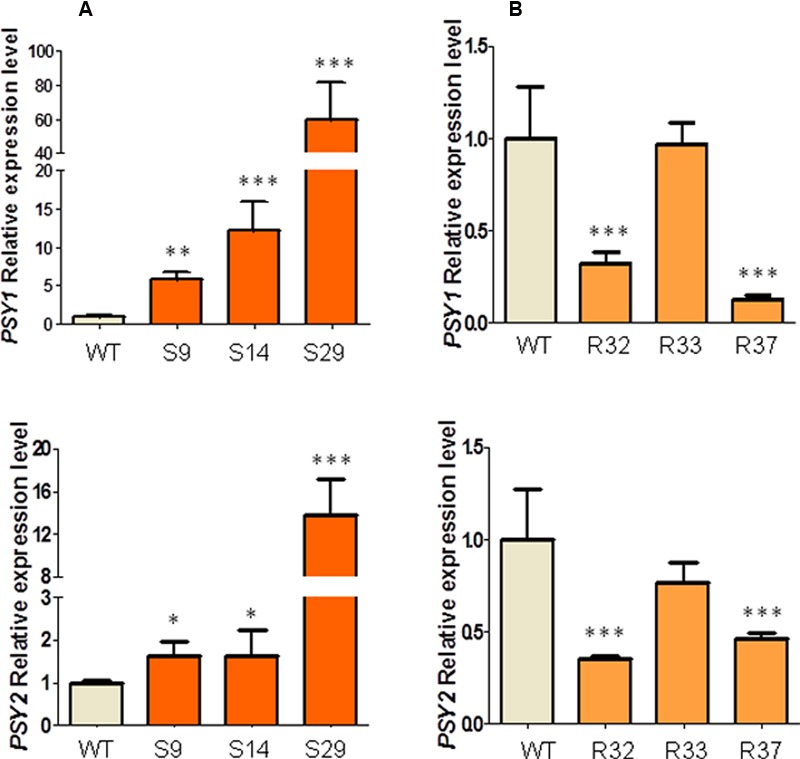
FIGURE 6.

Relative transcript expression of DcPSY1 and DcPSY2 in leaves of AtDXS and AtDXR carrot transgenic lines. (A) DcPSY1 and DcPSY2 expression in leaves of three representative DXS transgenic lines. (B) DcPSY1 and DcPSY2 expression in leaves of three representative DXR transgenic lines. Assay was carried out in triplicate and normalized to RNAr18S expression. Expression of WT plants were used as calibrator and settled in 1. Asterisks indicate significant differences between transgenic lines and wt plants determined by two-tailed unpaired Student’s t-test. ∗p < 0.05; ∗∗p < 0.01; ∗∗∗p < 0.001.
