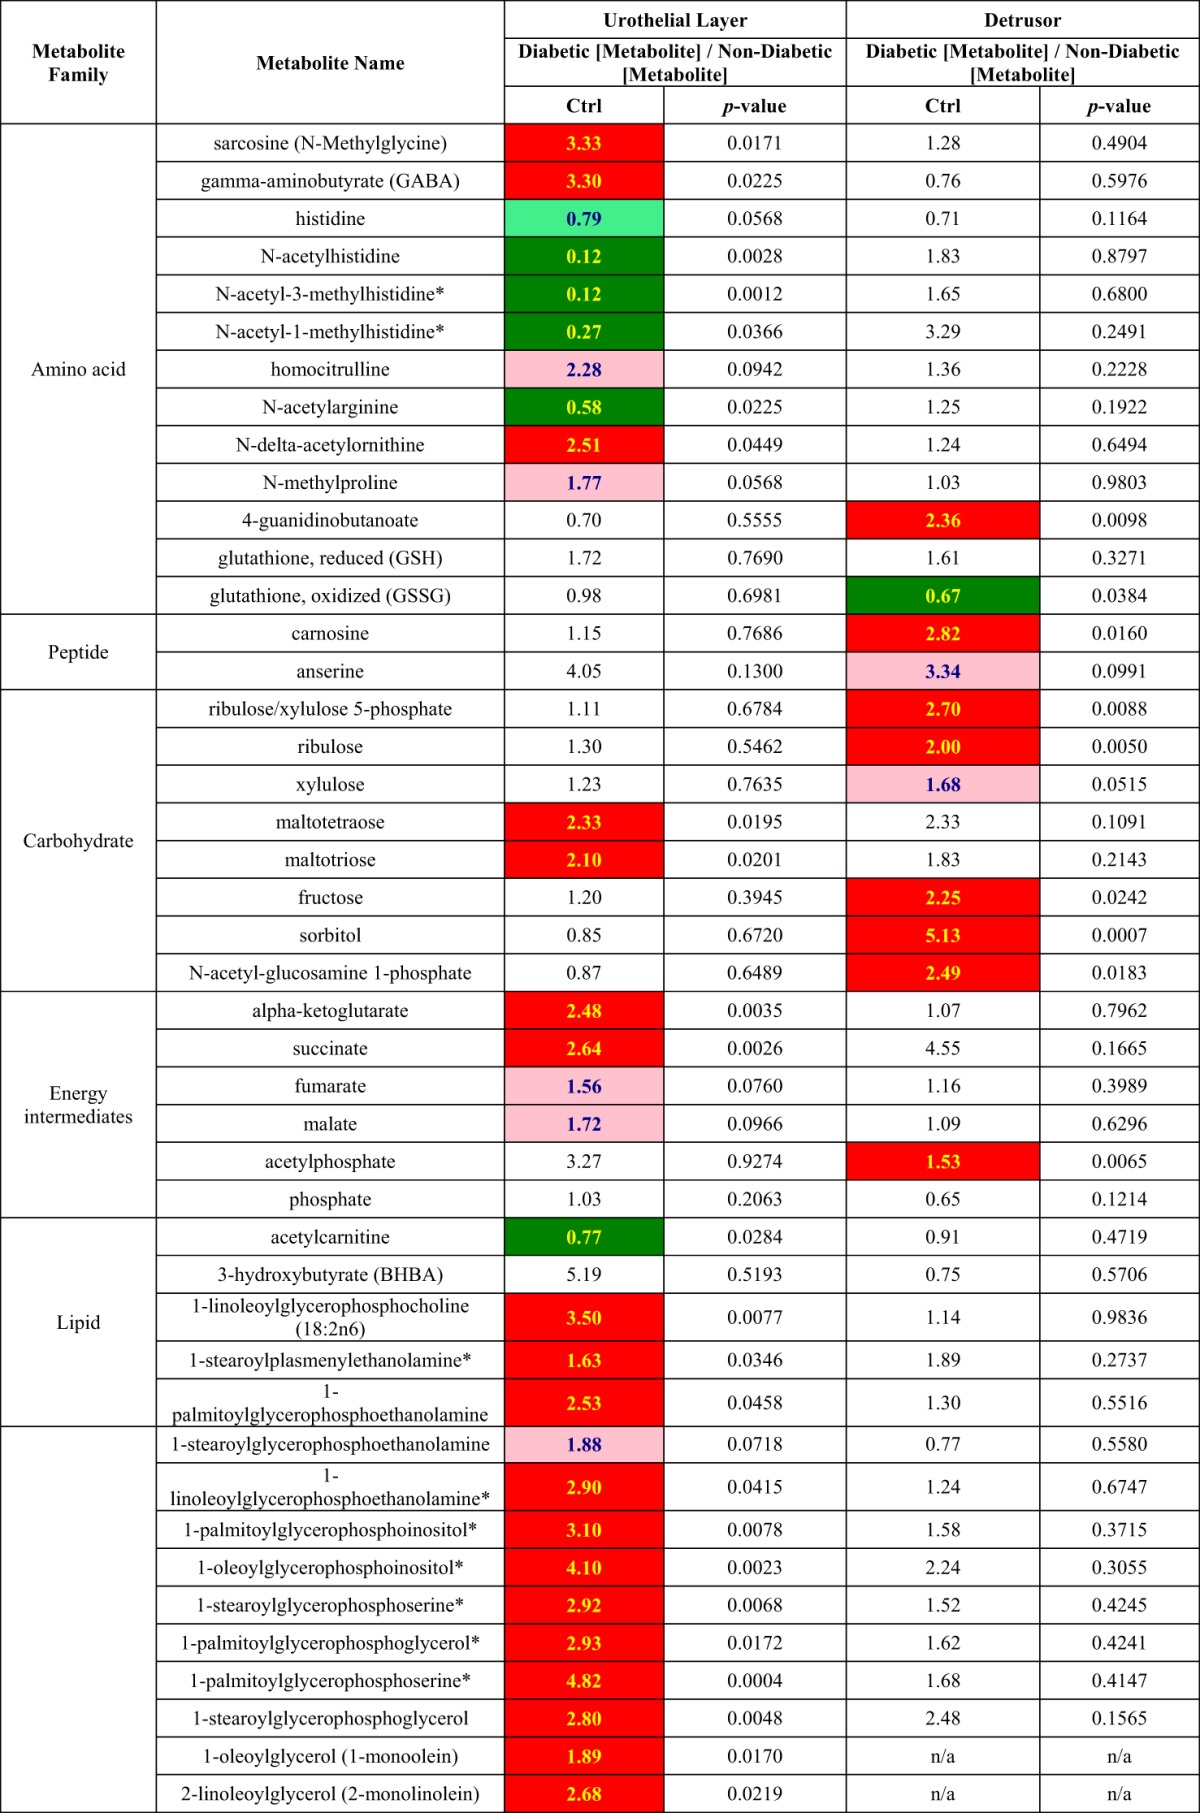
Table 4.
Different diebetes-mediated changes in metbaolite levels in detrusor and urothelial layer

ANOVA contrast analysis was performed for specific comparison between diabetic groups and control groups. Dark green, significant difference (P ≤ 0.05) between the groups shown, metabolite ratio of <1.00; light green, a trend/narrowly missed statistical cutoff for significance 0.05 < P < 0.10, metabolite ratio of <1.00; red, significant difference (P ≤ 0.05) between the groups shown, metabolite ratio of ≥1.00; pink, narrowly missed statistical cutoff for significance 0.05 < P < 0.10, metabolite ratio of ≥1.00.
