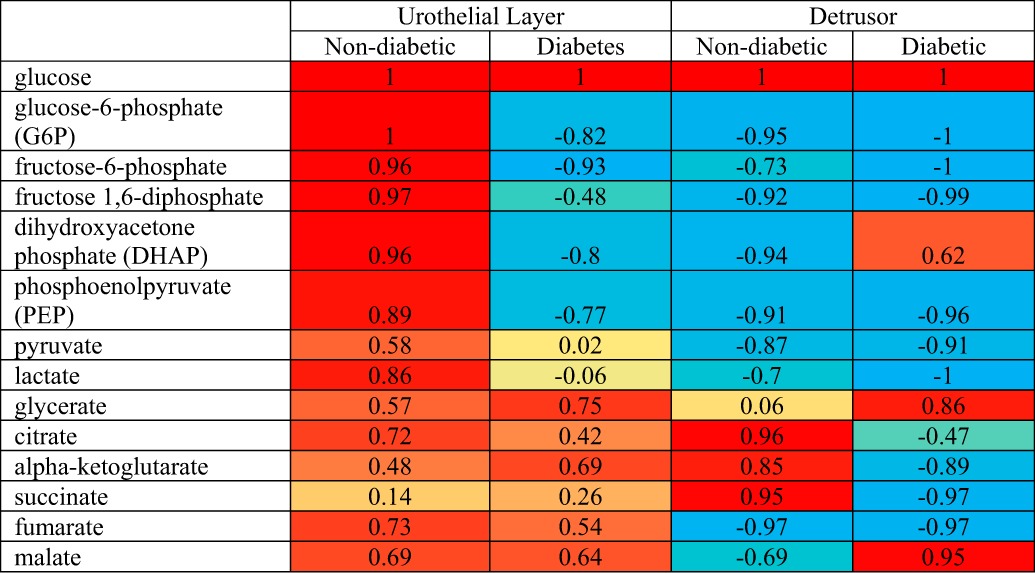
Table 5.
Pearson's correlation of glucose to other metabolites in the nondiabetic and diabetic detrusor and urothelial layer

Correlation value ranges from −1 to 1. A negative value indicates a negative relationship and a positive value implies a positive correlation. Red, yellow, and blue color codes represent values statistically not different from +1, 0, and −1, respectively. Values between 0 to +1 and 0 to −1 are shown as a proportionally mixed combination of 2 colors (red and yellow and blue and yellow, respectively).
