Fig. 7.
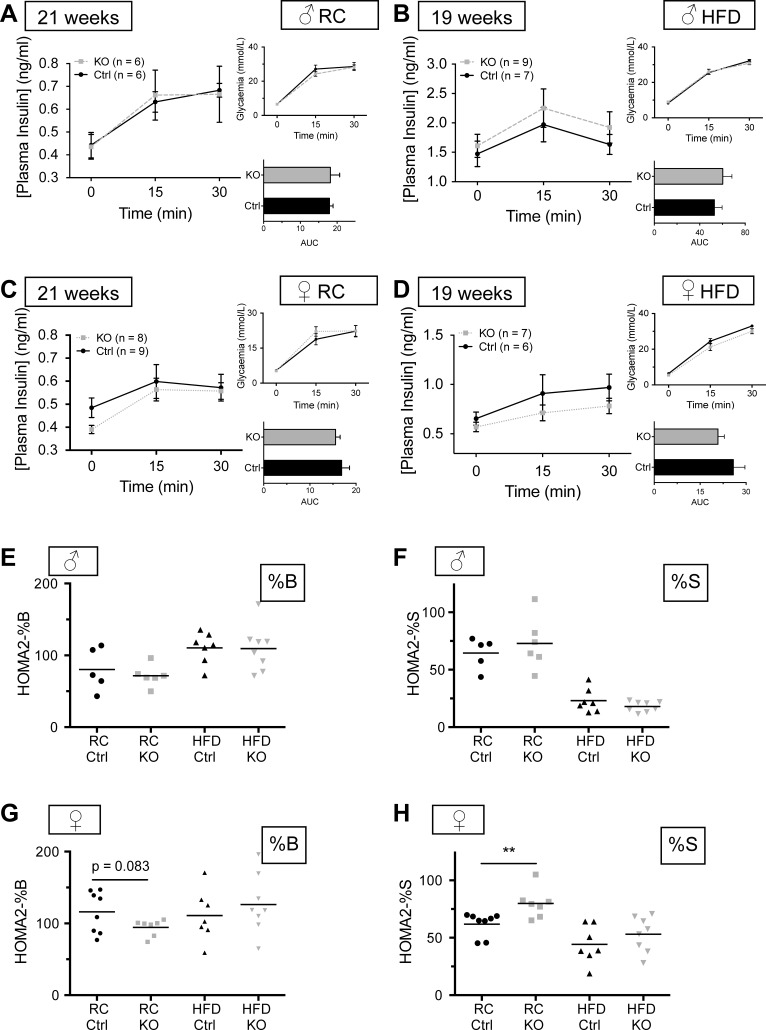
Effect of Vps13C deletion on glucose-stimulated insulin secretion (GSIS) in vivo. A–D: plasma insulin concentration was measured following intraperitoneal administration of glucose (3 g/kg body wt) in Ctrl (solid black line) and KO [dashed (males) or dotted lines (females)] littermates. Blood was sampled for insulin measurements when mice were 21 or 19 wk old (RC or HFD, respectively). Inset, top: respective glycemia measurements. Inset, bottom: AUC calculated from the main graph, measuring total released plasma insulin; n = 6–9 mice per genotype, as detailed in the key. E–H: homeostatic model assessment analysis (HOMA2)-%B (E and G) and -%S (F and H) analysis using fasting glycemia values and corresponding plasma insulin concentrations, respectively. **P < 0.01, unpaired Student's t-test with Welch's correction (E–H).

