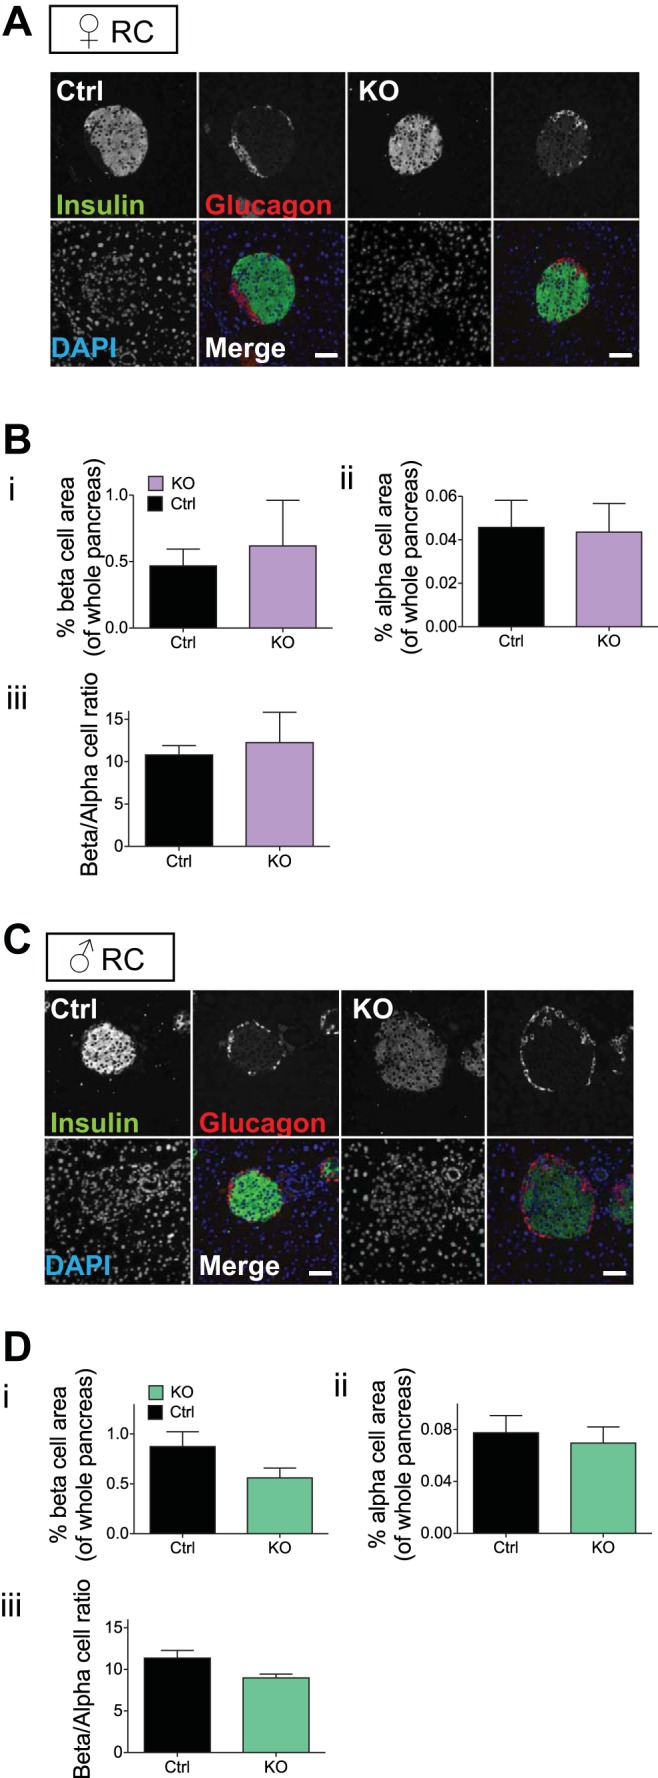
Fig. 9.

β-Cell mass in βVps13cKO mice. A and C: representative images from pancreatic slices from female (A) and male (B) Ctrl and KO mice (20–23 wk of age) fed a RC diet. Slices were stained with antibodies against insulin (green) and glucagon (red). Nuclei were stained with DAPI; scale bar represents 50 μm. B and D: percentage of β- (i) and α-cell (ii) surface area, normalized to whole pancreas surface area; (iii): β/α-cell ratio. Data are from n = 3 Ctrl and 3 KO females and 3 Ctrl and 5 KO males. No significant differences between genotypes were detected.
