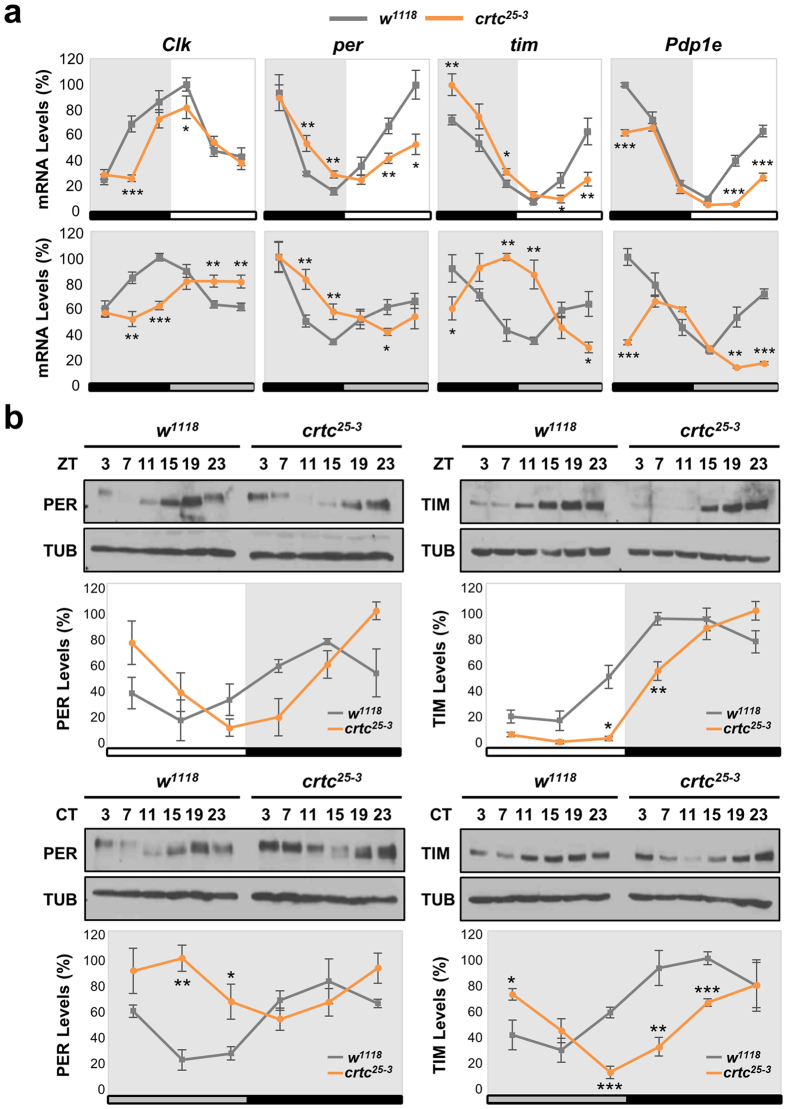
Figure 3. crtc mutation phase-delays circadian gene expression in adult fly heads.
(a) Circadian expression of clock mRNAs in adult fly heads of wild-type (gray lines) and crtc mutants (orange lines). Flies were collected at six different time-points in LD cycles (top) or during the transition from the first to the second DD cycle following LD entrainment (bottom) and total RNAs from heads were purified. Relative levels of Clk, per, tim, and Pdp1 mRNAs were quantified by real-time RT-PCR. X-axis indicates zeitgeber time (ZT) in LD (top) or circadian time (CT) in DD (bottom). Y-axis indicates relative expression levels (%) at each time-point, calculated by normalizing to the peak value (set as 100). White/black bars, LD cycles; gray/black bars, DD cycles. Data represent the average of three independent experiments. *P < 0.05, **P < 0.01 and ***P < 0.001 as determined by Student’s t-test. Error bars indicate SEM. (b) Circadian expression of PER and TIM proteins in adult fly heads of wild-type (gray lines) and crtc mutants (orange lines). Head extracts were prepared from flies harvested during LD (top) or the first DD (bottom) cycle and immunoblotted with anti-PER, anti-TIM and anti-TUBULIN (TUB, loading control) antibodies under the same experimental conditions. Images were cropped from full-length blots shown in Supplementary Fig. 12. Protein band intensities in each lane were quantified using ImageJ software and normalized to that of TUB protein. Y-axis indicates the relative expression levels (%) of PER and TIM proteins, calculated by normalizing to the peak value (set as 100). White/black bars, LD cycles; gray/black bars, DD cycles. Data represent the average of three independent experiments. *P < 0.05, **P < 0.01 and ***P < 0.001 as determined by Student’s t-test. Error bars indicate SEM.

