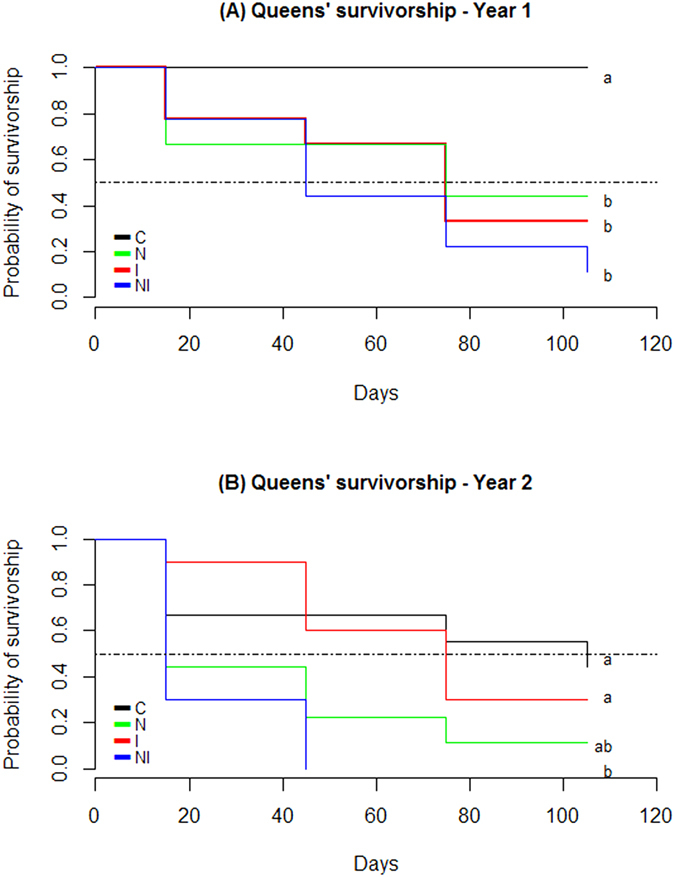
Figure 2. Kaplan Meier survivorship curves of honeybee queens in the field.

In laboratory conditions queens were divided in four groups to be parasite-inoculated and pesticide-exposed as follow: N. ceranae infected queens (N), imidacloprid exposed queens (I), both infected and exposed to imidacloprid queens (NI) and control queens (C). Queens were then introduced into mating nuclei placed in the field for 3 months. (A) Year 1 survivorship curves (n = 8, 9, 9, 9 for C, I, N and NI) and (B) Year 2 survivorship curves (n = 9, 10, 9, 10 for C, I, N and NI). Day 0 corresponds to the introduction of queens in the nuclei. Median lifespan (T50) is represented by a dot-dash line. Different letters denotes differences less than 5% of significance. Log-Rank test for 2010: C vs. N: p – value = 0.0151; C vs. I: p – value = 0.0058; C vs. NI: p – value = 0.0002; I vs. N: p – value = 0.774; N vs. NI: p – value = 0.212; I vs. NI: p – value = 0.312; and Log-Rank test for 2012: C vs. N: p – value = 0.0778; C vs. I: p – value = 0.643; C vs. NI: p – value = 0.0046; I vs. N: p – value = 0.0787; N vs. NI: p – value = 0.219; I vs. NI: p – value = 0.001.
