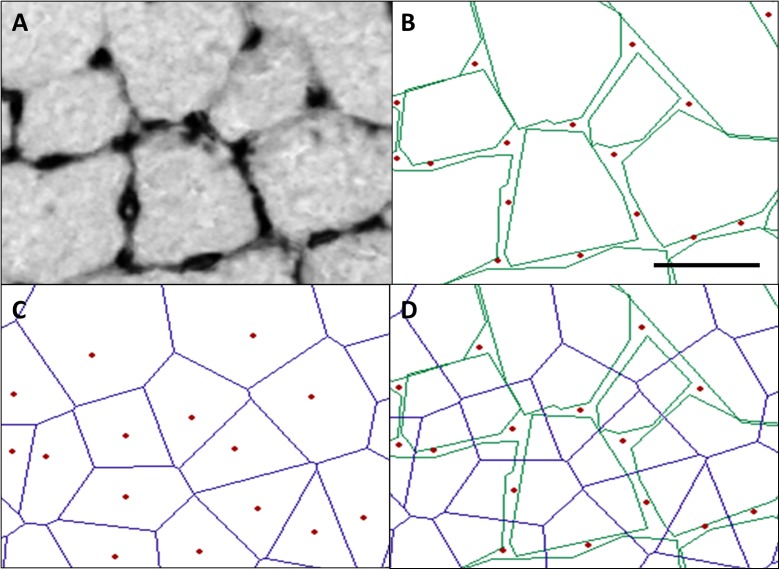
Fig. 6.
Illustration of the analyses of capillary data. a Typical example of capillaries identified with lectin staining in mice muscle. b In red, the capillaries, and in green, the muscle fiber outlines are shown, while in blue (c), the calculated capillary domains are depicted. d The overlap of domains and fibers, used to calculate fiber-specific capillary supply, as described in the methods section. Bar represents 30 μm (color figure online)

