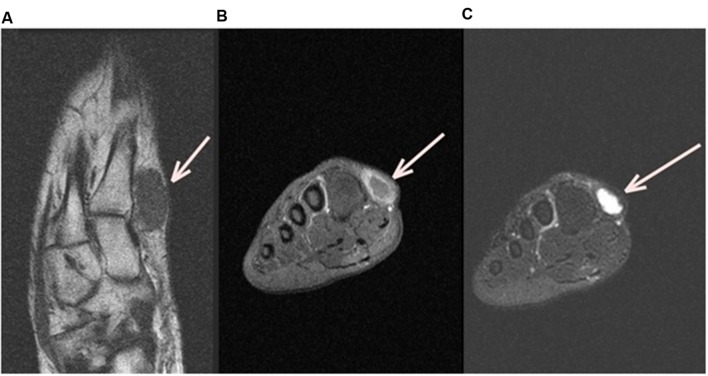
FIGURE 1.
Left Foot MRI (Magnetic Resonance Image). Axial MRI T1 left foot image (A) shows a subcutaneous ovoid mass of 3cm × 2cm in contact with the first metatarse (white arrow), coronal T1 fat sat with gadolinium (B) and Coronal T2 fat sat (C) show, respectively, an hyposignal T1 and a hyper signal T2 with peripheric enhancement after injection.

