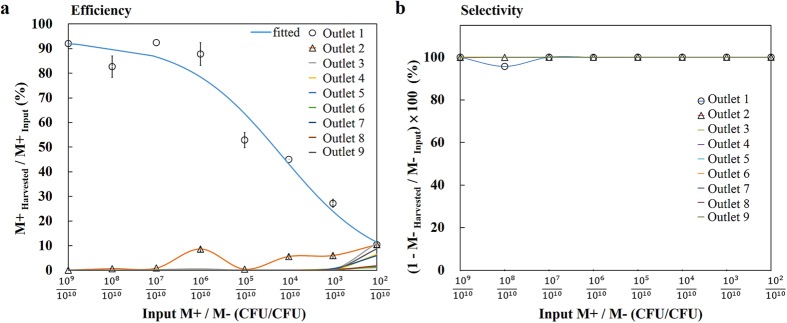
Figure 3. Sorting of antigen interactive (M+) and noninteractive (M−) phages using CMAIL is efficient and specific.
The input sample contained M+ phages ranging from 102 to 109 CFU and M− phages at a constant number of 1010 CFU. Hence, the mixing ratio of input M+ to M− phages ranged from 10−8 to 10−1 accordingly. Phages collected at outlets 1 to 9 were counted separately using conventional phage titer analyses (Supplementary Figure 5a). ELISA analysis was used to assess the percentage of bacterial colonies infected by M+ phages (Supplementary Figure 5b). (a) Most M+ phages were recovered at outlet 1 for the various mixing ratios of input M+ to M− phages evaluated. The efficiency, or the percentage of recovered M+ phages, remained greater than 80% when the mixing ratio was above 10−4, and dropped gradually to 10% when the mixing ratio was 10−8. (b) The specificity, or 100% minus the percentage of recovered M− phages, remained close to 100% for samples at all the outlets and mixing ratios evaluated.

