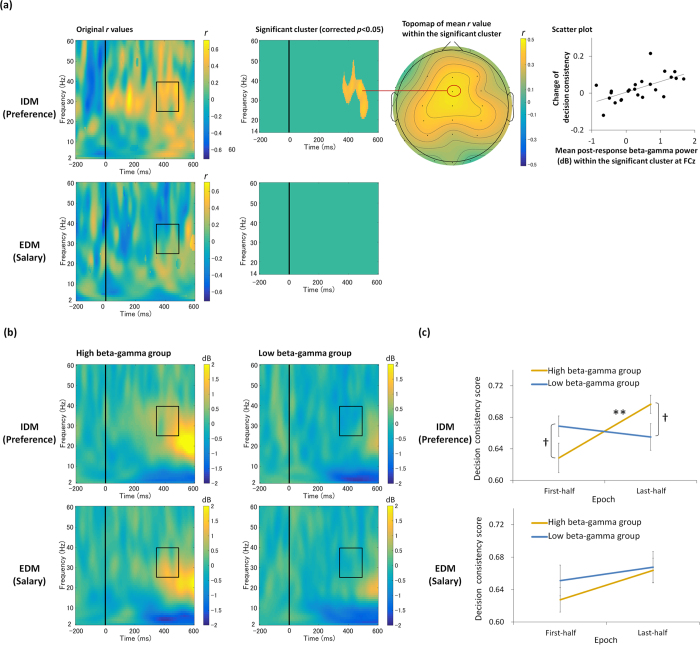
Figure 2.
(a) Correlation results between the response-locked event-related spectral perturbations (ERSP) at FCz for the first-half trials and the change of decision consistency (last-half trials–first-half trials) for each decision-making task (see also Fig. S4 for similar results obtained using pre-stimulus baseline corrected response-locked ERSP data). Scalp topography of the mean r-value within the significant cluster for the preference task, and the scatter plot between the change of decision consistency and mean beta–gamma power within the significant cluster are shown on the right side. (b) ERSP images at FCz for the first-half trials of IDM (preference) and EDM (salary) tasks are shown separately for high and low beta–gamma groups of each task. These figures are presented for illustration purposes. (c) Decision consistency for the first-half and the last-half trials in IDM (preference) and EDM (salary judgment) tasks shown separately for high and low beta–gamma groups. †Denotes a marginal difference of p < 0.10. **Denotes a significant difference of p < 0.005. Error bars represent standard errors. Rectangles presented in the original r-values for preference task (a) and ERSP images (b) show the time-frequency window used for calculating the average power for dividing high and low beta–gamma groups. Internally guided and externally guided decision-making are denoted respectively as IDM and EDM.

