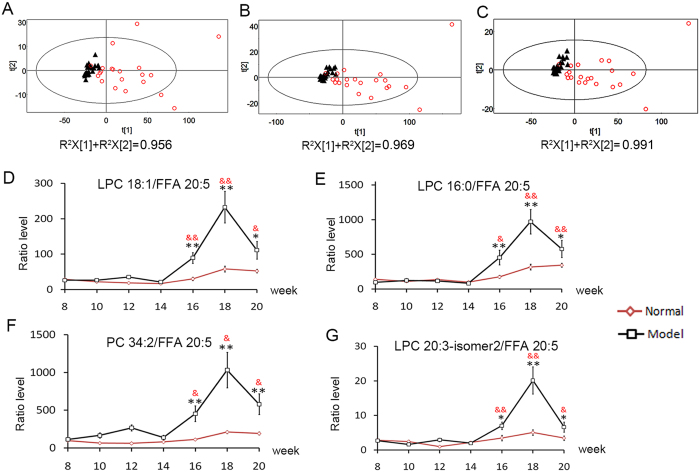
Figure 3. The results of the dynamic concentration analysis and topological structure analysis.
(A,B) are PCA score plots based on the results of dynamic concentration and topological structure analyses, respectively. (C) is PCA score plot based on 15 feature ratios selected by both dynamic concentration and topological structure analyses (Table S3). Non-HCC (black ▲), HCC (red ○). (D–G) are the metabolic trajectories (mean ± S.E) of LPC 18:1/FFA 20:5, LPC 16:0/FFA 20:5, PC 34:2/FFA 20:5 and LPC 20:3-isomer2/FFA 20:5 in the discovery set. The black *indicates statistical significance between the control group and model group. The red & indicates statistical significance between the typical CIR (T4, week 14) and anytime points at the HCC stage (T5 − T7, weeks 16–20). *and &:p < 0.05, **and &&:p < 0.01. LPC, lyso-phosphatidylcholine; PC, phosphatidylcholine; FFA, free fatty acids.

