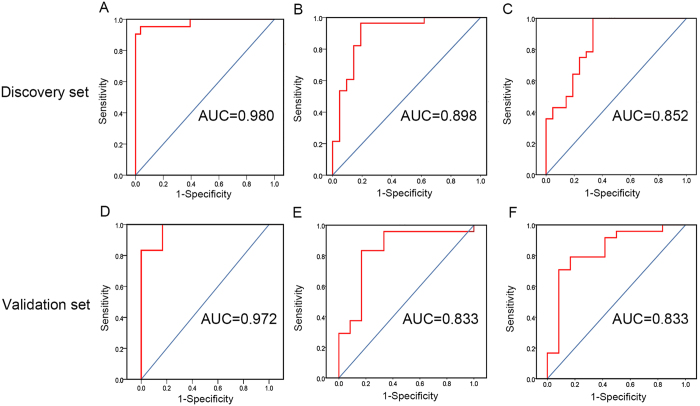
Figure 4. Comparison among ATSD-DN, SVM-RFE, wRDA and MEBA.
(A,C) are ROC curves based on the analysis of ATSD-DN and SVM-RFE in the discovery set, while (D,F) are the corresponding ROC curves in the validation set. (B) is the ROC curve from wRDA and MEBA with the same screening result in the discovery set, and (E) is the corresponding ROC curve in the validation set.

