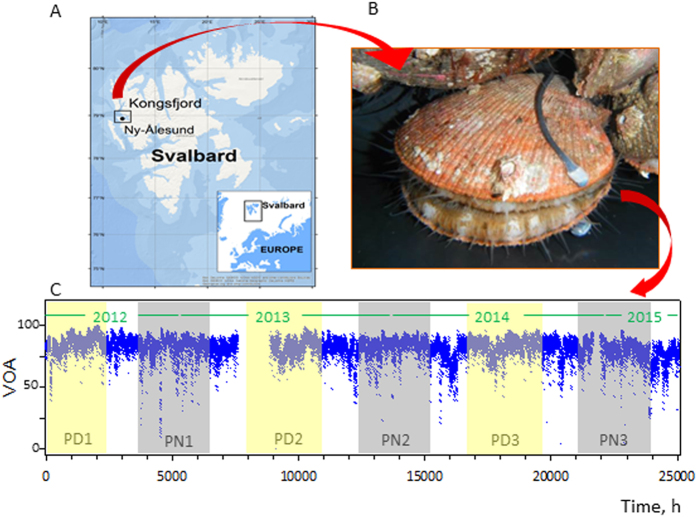
Figure 1. Locations of the scallops equipped with devices to record their valve behaviour.
(A) Map showing the location of Ny-Alesund (78° 56′ N, 11°56′ E) where the study was conducted. The map was created using ArcGIS 10.2. The base map was built from a layer created by ‘Esri, DeLorme, GEBCO, NOAA NGDC, and other contributors’ available from https://www.arcgis.com/home/item.html?id=1e126e7520f9466c9ca28b8f28b5e500. (B) One of the 14 scallops (C. islandica) equipped with the electrodes of the HFNI valvometer biosensor. (C) Representative record of an individual scallop’s valve behaviour. In yellow: polar days (PD); in grey: polar nights (PN); in white: days with alternating light/dark periods (AL).

