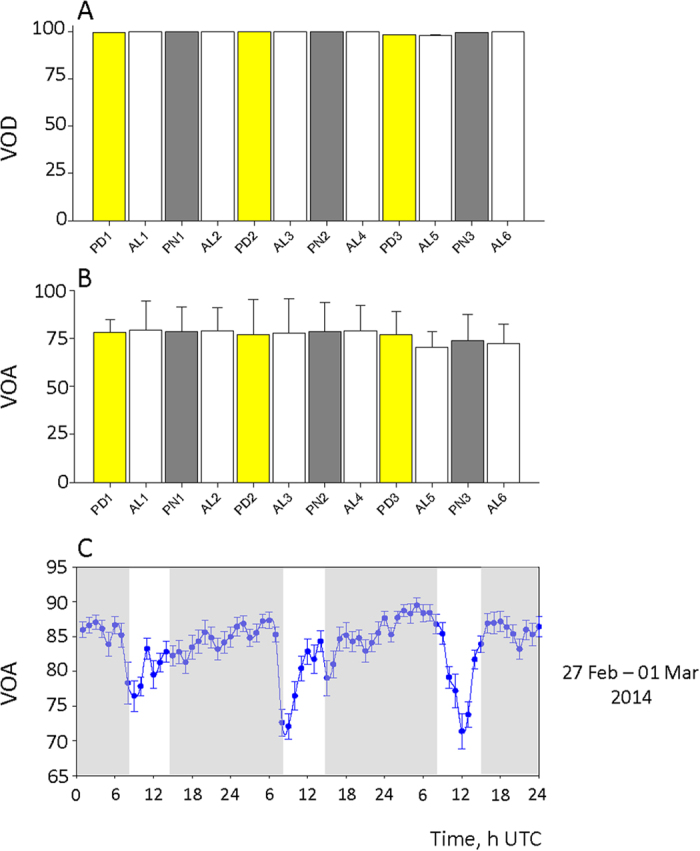
Figure 2. Group valve behavioural activity of C. islandica.

(A) Mean (n = 14) valve opening duration (VOD, %) during the studied seasons. (B) Mean (n = 14) valve opening amplitude (VOA, %) during the studied seasons. For (A,B): yellow bars: polar days (PD); grey bars: polar nights (PN); white bars: days with alternating light/dark periods (AL). (C) Mean typical behaviour during the 3 days in the AL4 season (February 27th -March 1st, 2014), which shows the VOA (%) ranging from 65% to 95%. Time zero: 13 h UTC. In grey: polar night periods.
