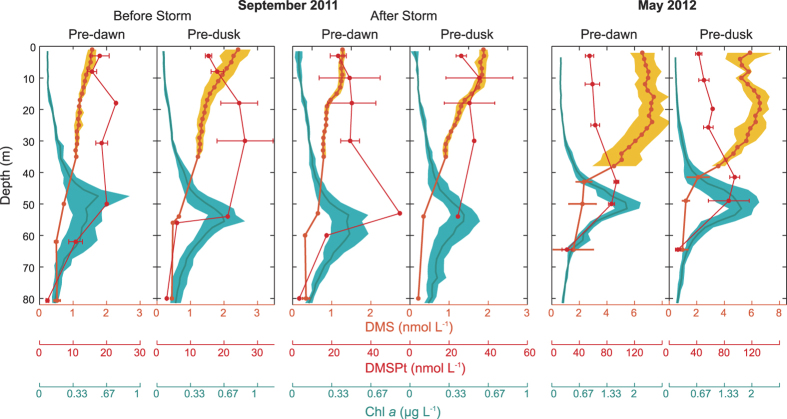
Figure 3. Vertical patterns.
Averaged vertical profiles from the surface to below the deep chlorophyll maximum (DCM) for DMS (nmol L−1), DMSPt (nmol L−1) and Chl-a (μg L−1; fluorescence profiles calibrated with extracted chla measured in discrete bottles). DMS below 35 m and DMSPt data are from discrete samples from CTD rosette. DMS above 35 m and chla profiles are 30 seconds means of measurements from the continuous vertical profiler, and standard deviations are indicated as shaded areas. Pre-dawn and pre-dusk profiles are shown for (A) 13–14 September before storm, (B) 21–22 September after storm, (C) May. The depth of the mixing layer is indicated in Fig. 4.

