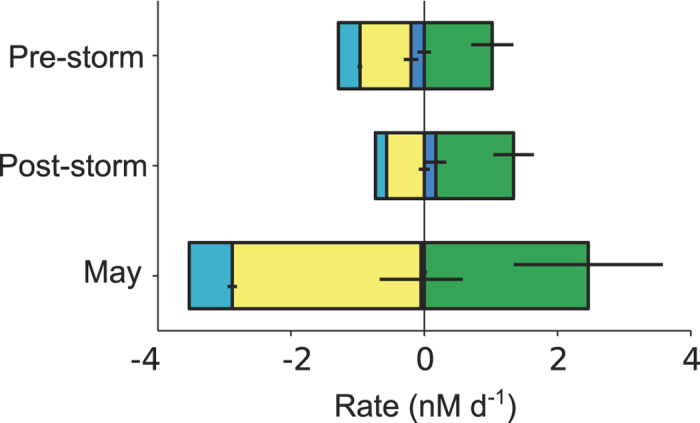
Figure 7. Average mixed-layer budgets of DMS source (positive) and loss (negative) process rates and their associated uncertainties in the three intensive studies.

The 48-h averages are shown for ventilation (light blue), photolysis (yellow), vertical transport (dark blue) and net biological production (green). Numbers are given in Table S4.
