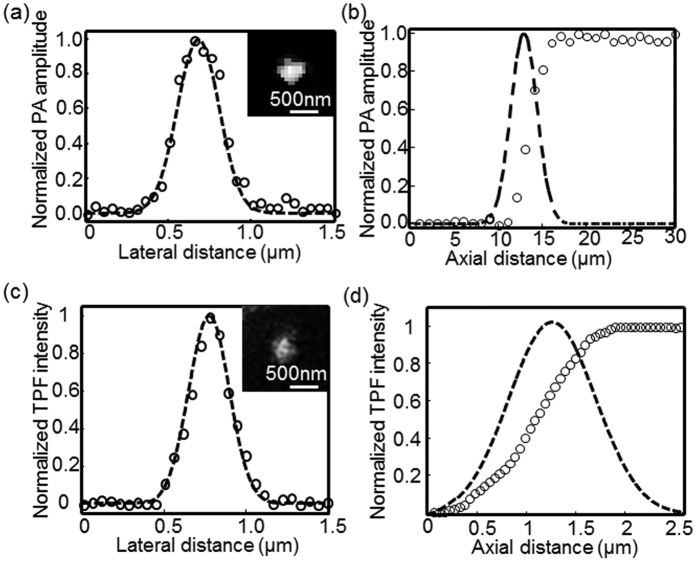
Figure 2. Spatial resolution quantification of multimodal microscopy.
(a) Lateral resolution of PAM estimated by imaging graphite nanoparticles ~80 nm in diameter. The inset illustrates a representative PAM image of a graphite nanoparticle. (b) PAM axial resolution determined by recording PA amplitudes of India ink solution along a one-dimensional depth. Gaussian fitting was performed by taking the first derivative of the measured data. (c) The TPM lateral resolution was estimated by imaging fluorescent beads that was 100 nm in diameter. The inset displays a representative nanoparticle acquired by TPM. (d) Determination of TPM axial resolution. Fluorescence intensity values of the fluorescent solution along the depth were recorded, and the first derivative was fitted to a Gaussian function. The hollow circles and dashed lines represent the measured raw data and fitted profiles, respectively.

