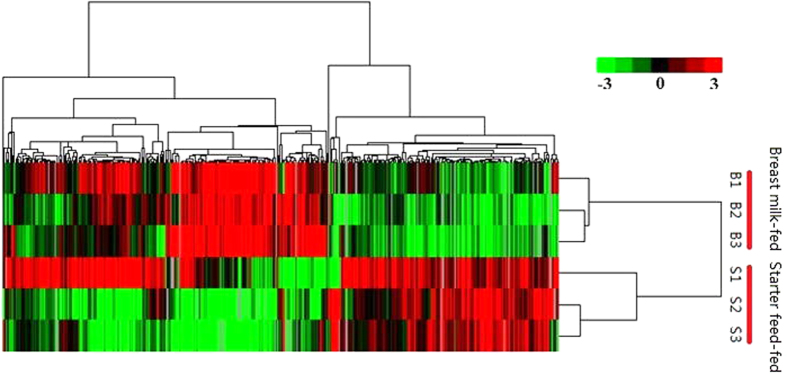
Figure 1. Average linkage hierarchical clustering analysis of the log2 transformed change ratio of 18,716 unigenes generated with Cluster 3.0 software.
Data are shown in a tree analysis generated using the software package Java Treeview. Each row represents a differentially expressed gene and each column represents a sample. Green and red colour gradients indicate a reduction or increase in transcript abundance, respectively.

