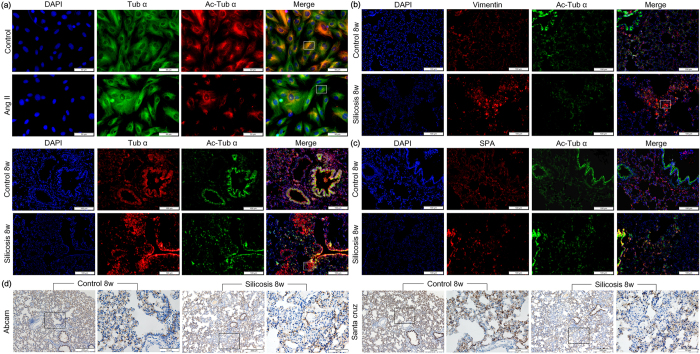
Figure 2. The co-expression of Tub-α and α-Ac-Tub in lung tissue and fibroblasts.
(a) The co-expression of Tub-α and α-Ac-Tub in lungs of rat silicosis model and fibroblasts induced by Ang II measured by immunofluorescence. Scale bar = 100 μm and 50 μm. (b) The co-expression of α-Ac-Tub /vimentin in lung tissue. Scale bar = 100 μm. (c) The co-expression of α-Ac-Tub /SP-A in lung tissue. Scale bar = 100 μm. (d) The expression of α-Ac-Tub in silicosis assayed by immunohistochemistry with two different commercial antibodies. Scale bar = 200 μm and 50 μm.

