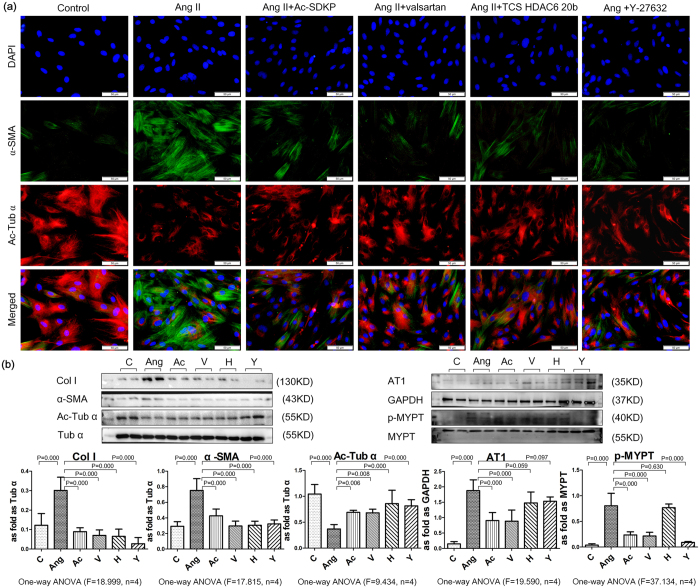
Figure 4. Effect of Ac-SDKP on col I, α-SMA and α-Ac-Tub in fibroblasts induced by Ang II.
(a) The co-expression of α-SMA and α-Ac-Tub in fibroblasts induced by Ang II measured by immunofluorescence. Scale bar = 50 μm. (b) Effect of Ac-SDKP, valsartan (AT1 inhibitor), TCS HDAC6 20b (specific HDAC6 inhibitor), and Y-27632 (ROCK inhibitor) on fibroblasts measured by Western blot. Data presented as mean ± SEM; N = 4 independent experiments.

