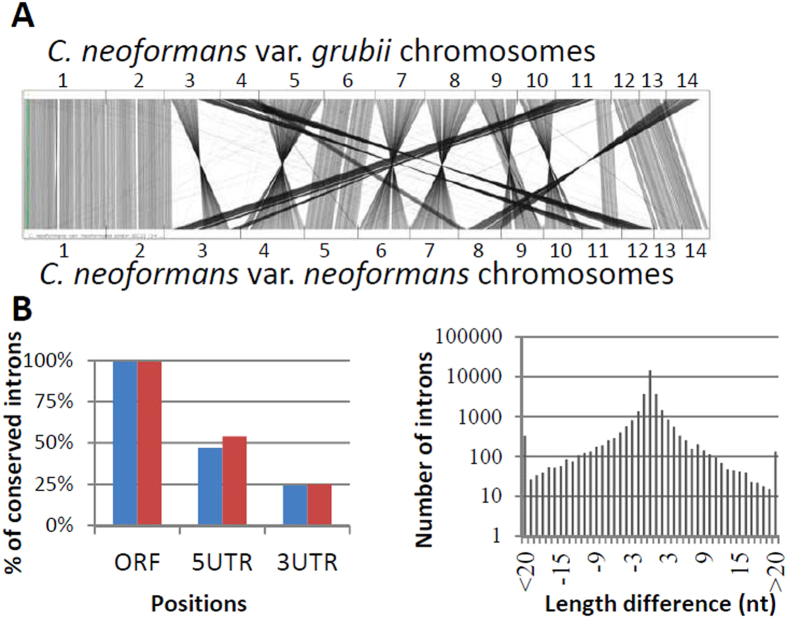
Figure 1. Genome comparison between C. neoformans var. neoformans and C. neoformans var. grubii.
(A) Position of orthologous genes in C. neoformans var. neoformans and C. neoformans var. grubii as visualized using SynTView63. (B) Right panel. Conservation of intron position between C. neoformans var. neoformans and C. neoformans var. grubii according to the position of the introns within the genes. The blue bars represent the percentage of var. grubii introns conserved in the var. neoformans and the red bars represent the percentage of var. neoformans introns conserved in the var. grubii. Left panel. Size conservation of the ORF introns between the two varieties.

