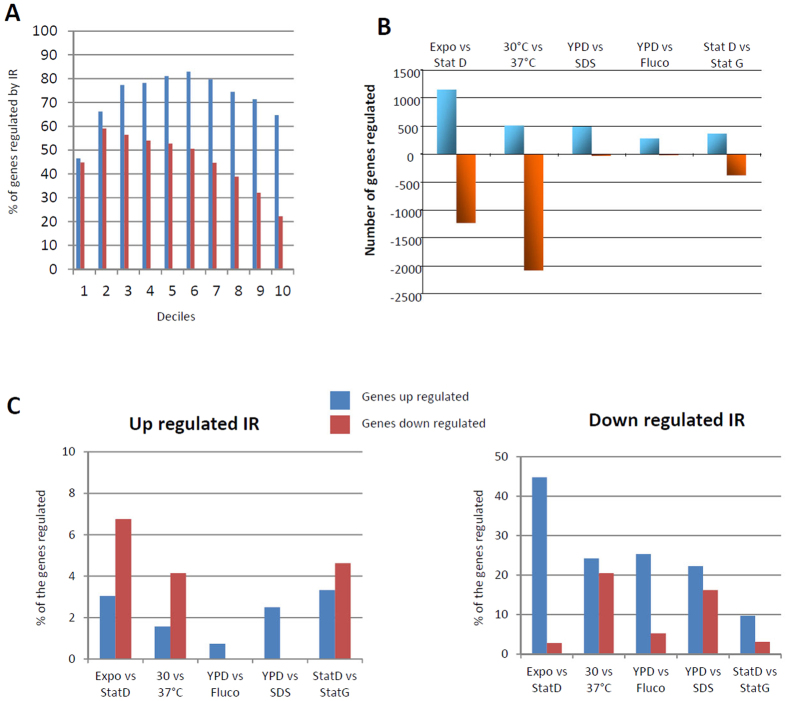
Figure 5. Intron retention and gene expression regulation is linked.
(A) The most highly expressed genes are less regulated by IR than moderately expressed genes. Genes were separated into deciles according to level of expression at 30 °C in the exponential phase. The percentage of genes regulated by IR in this condition (1% threshold blue; 5% threshold red) is reported. (B) Gene expression regulation in each comparison. (i.e. Exponential phase 30 °C [Expo]; Exponential phase 37 °C [37 °C], Stationary phase glucose [StatD]; Stationary phase galactose [StatG]; SDS 0.01% treatment [SDS]; 10 mg/L fluconazole treatment [Fluco]).(C) Proportion of genes up- or down-regulated when IR is up- or down-regulated. For each comparison, the gene lists for which IR down- or up-regulation was observed were compared with the gene lists for which up- or down-regulation of expression was observed. The percentages of overlap between these lists are reported.

