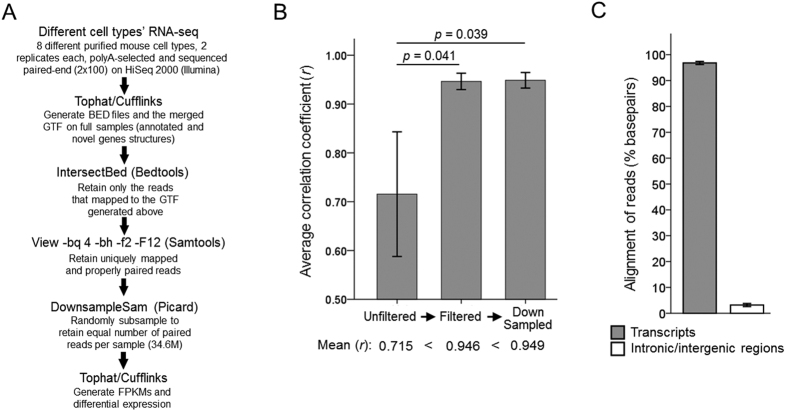
Figure 1. Preparation of datasets for analysis.
(A) Data filtering and gene expression analysis pipeline. (B) Mean correlation coefficient between replicates within the samples increases after filtering and subsampling (Pearson r, 2-tailed; n = 8; p-values by ANOVA with posthoc LSD). (C) On average over 95% of the filtered reads aligned to transcripts across cell types, with less than 5% percent aligning to introns and intergenic regions (n = 8, mean ± SEM of basepairs aligned to transcripts or introns/intergenic regions shown as percent of total aligned basepairs; alignment percent determined by Picard module RnaSeqMetrics).

