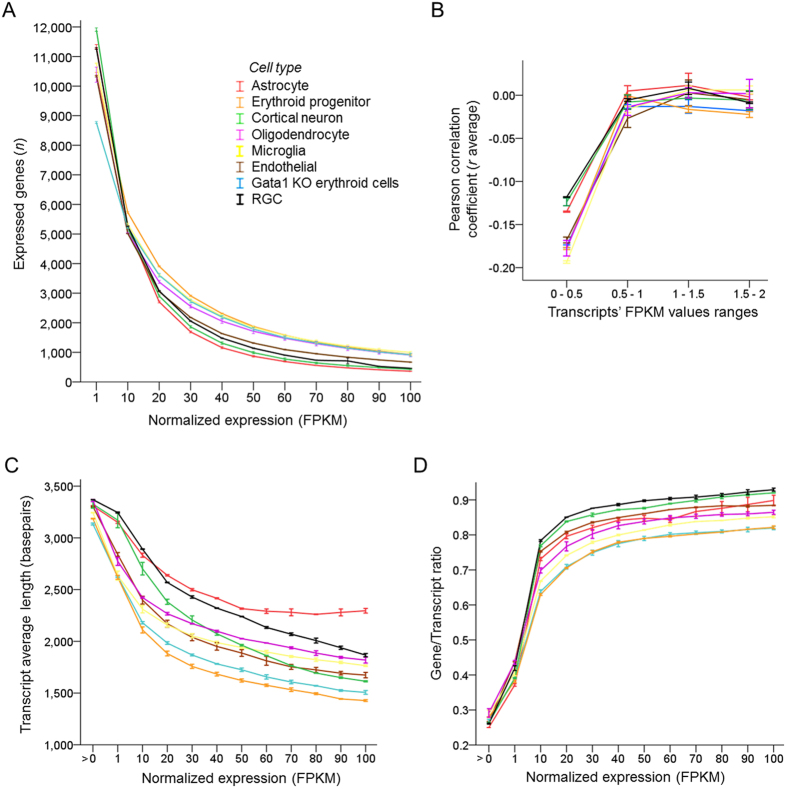
Figure 3. Cell types differ in the proportion of highly expressed genes and in the number of transcripts expressed per gene.
(A) Number of expressed genes plotted across increasing normalized expression (FPKM) thresholds for different cell types, as marked (8 cell types, 2 replicates each, mean ± SEM shown; the mean FPKM values were statistically significantly different, p < 0.001, F = 63.2, by ANOVA with repeated measures, sphericity assumed). (B) Correlation analysis of transcript length and its level of normalized expression at different FPKM ranges shows weak correlation at very low levels of expression, but no correlation above 1 FPKM (shown Pearson correlation coefficient r mean ± SEM for each cell type, as marked; 2 replicates per cell type). (C) Cell type samples vary in average transcript length, which decreases at higher expression thresholds (shown transcript length mean ± SEM for each cell type, as marked; 2 replicates per cell type). (D) Cell type samples vary in ratio of expressed transcripts per gene (genes divided by transcripts), which increases at higher expression thresholds (shown transcript length mean ± SEM for each cell type, as marked; 2 replicates per cell type).

