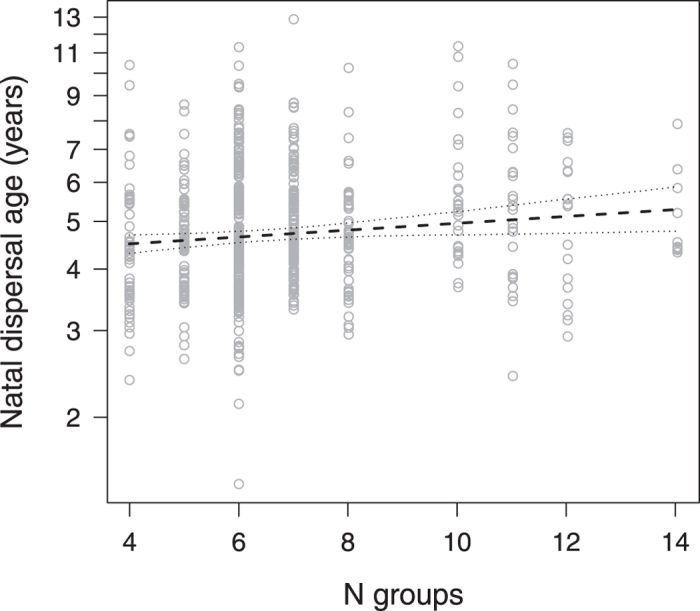
Figure 2. Natal dispersal age (years) as a function of the number of groups available for dispersal.

Points depict the raw data, lines show the fitted model (dashed) and 95% confidence limits (dotted) conditional on the other predictors being at their average.
