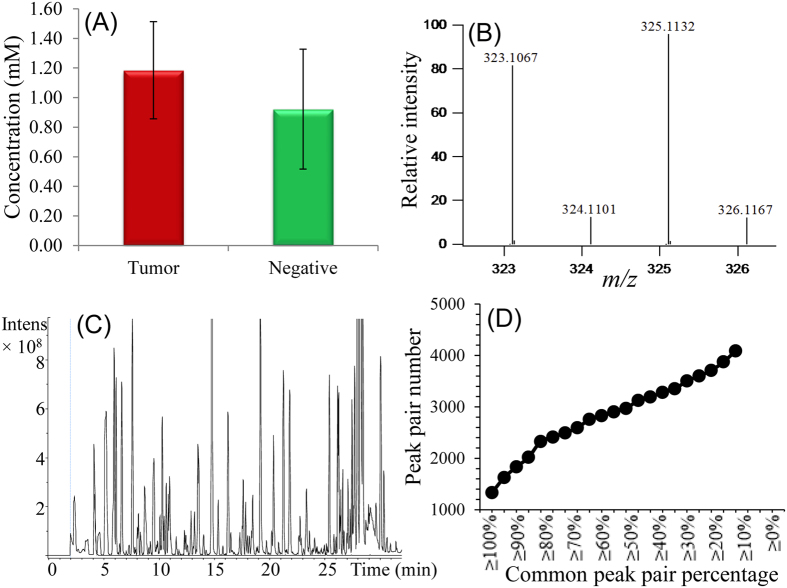
Figure 2.
(A) Absolute total concentration of labeled metabolites in tumor and normal (negative) mPREF extracted metabolomic samples. (B) Example of base-peak ion chromatogram of Dns-labeled sample obtained by LC-MS. (C) Example of mass spectral peak pair of a 13C-/12C-dansyl labeled metabolite (Dns-Alanine). (D) Number of peak pairs as a function of common peak pair percentage across all the samples.

