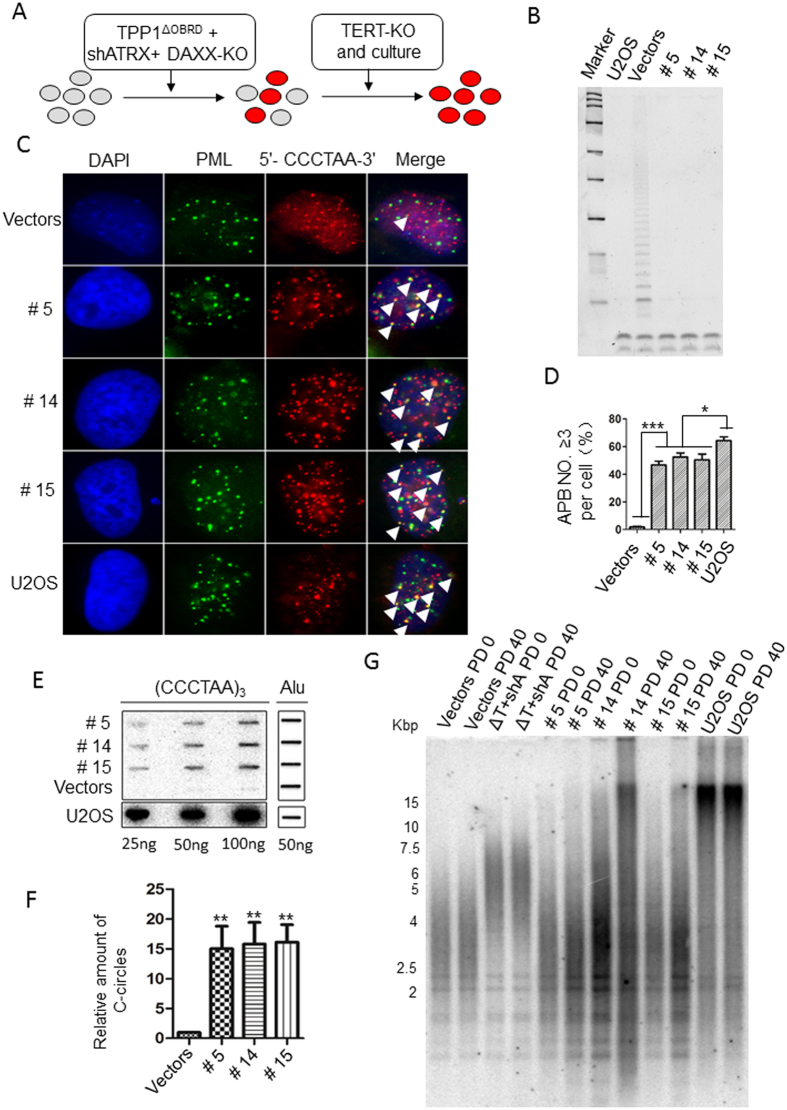
Figure 4. The detection of ALT activity in the TPP1ΔOBRD, ATRX knockdown, DAXX knock out and hTERT knock out cell lines.
(A) Strategy for the construction of the ALT-like cell lines. The red circles indicate the potentially transformed cells. (B) TRAP assay to detect telomerase activity in the TERT-KO clones. We used the ΔT + shA + D-KO cell line to construct three TERT KO clones #5, #14 and #15. The bands at the bottom represent the internal control. U2OS cells were used as the positive control and HTC75 cells with vectors were used as the negative control. (C) IF-FISH staining for the #5, #14 and #15 cell lines. The PML bodies are labelled green. The telomeric DNA was labelled with (5′-CCCTAA-3′) 3 probes (red). The white arrowheads indicate the APBs (yellow). (D) Statistical quantification of (C). The error bars indicated the standard error (n = 3). *P < 0.05; ***P < 0.001. (E) C-circle assay were performed to detect C-circles. U2OS cells were used as the positive control. (F) Statistical quantification of (E). The final relative amount of c-circles is the relative amount to vectors. The error bars indicate the standard error (n = 3). **P < 0.01. (G) Telomere length was detected using a TRF assay for different cell lines at PD0 and PD40. HTC75 cells with vectors were used as the negative control. U2OS cells were used as the positive control. #5, #14 and #15 represent different ΔT + shA + D-KO + TERT-KO cell lines. ΔT, TPP1ΔOBRD; shA, ATRX shRNA2; D-KO, DAXX knock out; TERT-KO, hTERT knock out.

