
Figure 3. Dispersion diagram of 1DPCs.
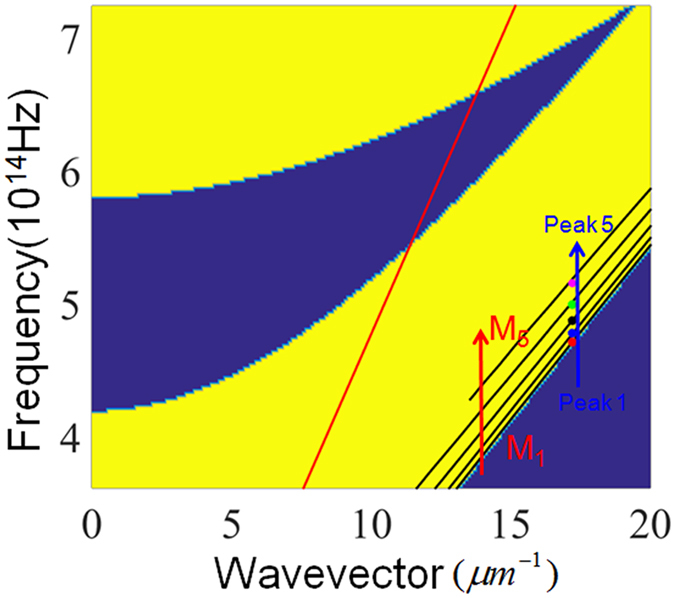
The line Mi (i = 1, 2, 3, 4, 5) denotes the ith-order dispersion line of the guided mode of 1DPCs. Points with different colors correspond to Peak i on the absorption spectrum of Device I. The red line denotes the light curve.