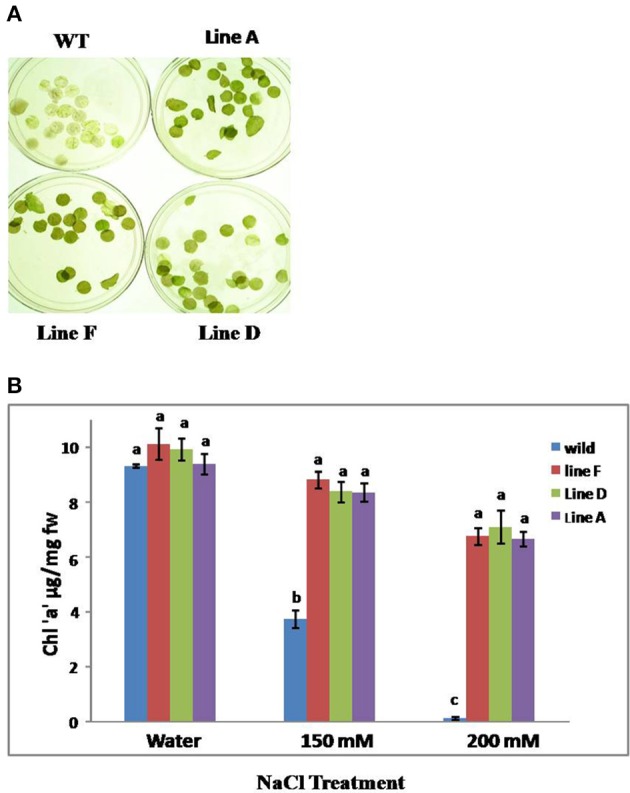
Figure 4.

(A) Leaf disc assay for chlorophyll loss in WT and transgenic lines after 150 mM NaCl treatment and (B) Chlorophyll estimation after leaf disc assay with WT and TopoII over-expressing tobacco transgenic lines under salinity stress condition. Bars represent means and standard errors (n = 3) and those noted with same letters are not significantly different at P < 0.05 by Tukey's test.
