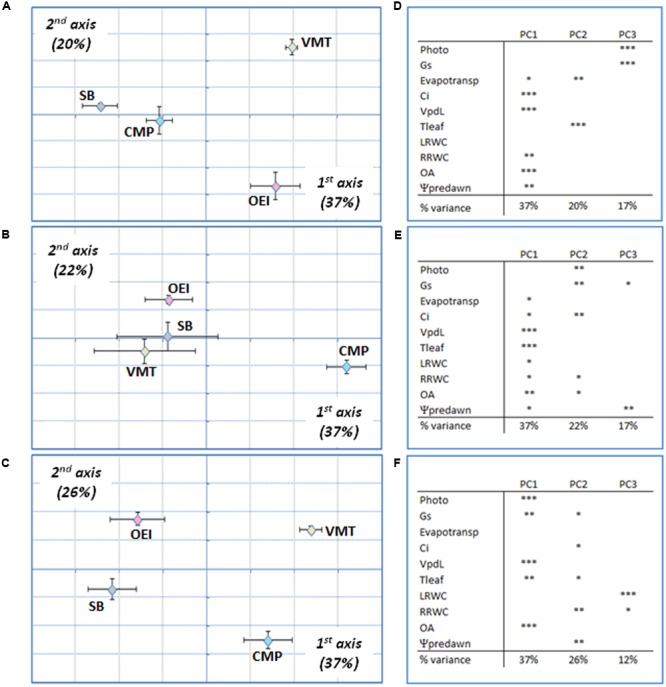
FIGURE 4.

Wild beets (OEI, CMP, VMT) and sugar beet responses submitted to a progressive salinity stress induced by watering with 200 mM analyzed by PCA at early stress (A,D), late stress (B,E) and recovery for 3 days (C,F). (A–C) Plot showing the variance along the first two components; (D–F) Principal components loadings (% of variation explained) and Pearson’s product moment correlation coefficient for each variable (∗p < 0.05, ∗∗p < 0.01; ∗∗∗p < 0.001). Four biological replicas were considered per genotype and stress level (raw data available as Supplementary Table S1).
