Figure 3.
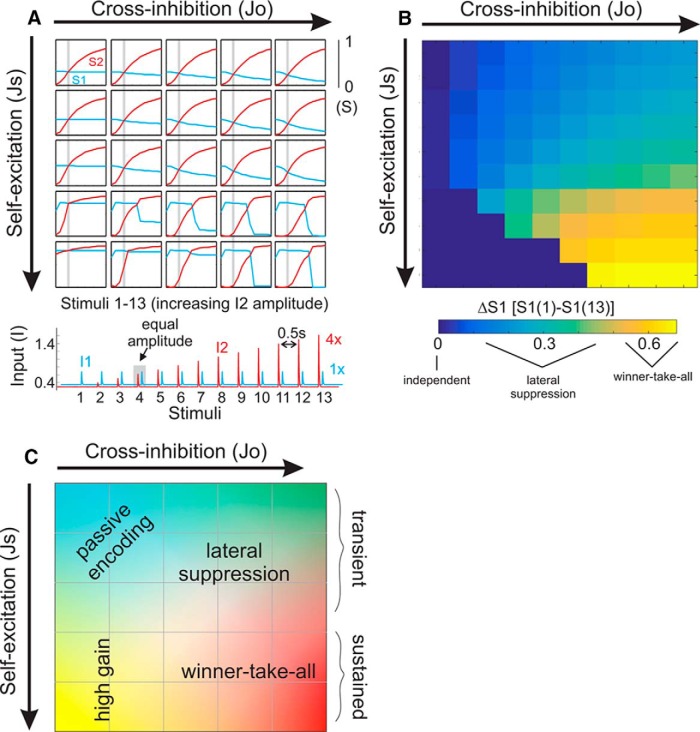
Patterns of cross-suppression across a wide range of values for synaptic coupling parameters Js and Jo. A, Top, Plot of peak responses of both ensembles for each of the transient stimuli. The trajectories of S2 reflect both increasing stimulus amplitude and intrinsic circuit dynamics. As the transient inputs to ensemble 1 (I1) are equivalent throughout this simulation, differences in S1 trajectories reflect changes in circuit dynamics alone. The gray bar in each plot refers to the condition in which I1 = I2. For some simulations, we find that the S1 and S2 plots intersect at this point. For other simulations, the point of intersection is shifted rightward, indicating a dependence on previous activity. Bottom, Extended stimulus series used to generate the above data. B, Quantification of cross-suppression, as the difference in S1 from the first compared to the last stimulus (ΔS1). C, Illustration summarizing the functional regimes accessible through parameterization of our circuit model. Changing self-excitation and cross-inhibition produces a family of functional circuits with diverse input–output response properties. Indication of “transient” versus “sustained” regimes are based on simulations as shown in Figure 2.

