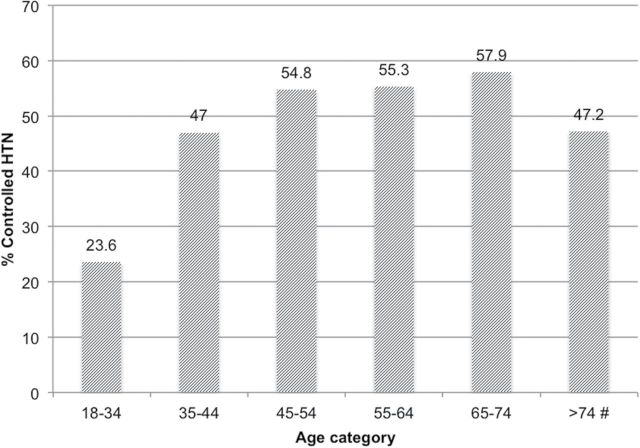
Figure 2.
Proportion of controlled HTN by age group. #Proportion of controlled HTN statistically significantly different between age >74 when compared to ages 65–74, 55–64, 45–54, and 18–34 (P < 0.001). No statistically significant difference in proportion of controlled HTN between age ≥75 and age 35–44 (P = 0.27). Abbreviation: HTN, hypertension.

