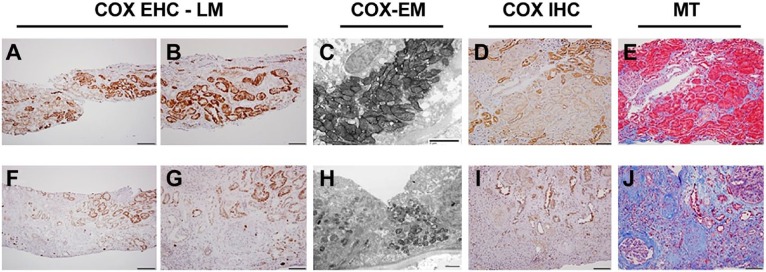
Figure 2.
Chronic allograft nephropathy (CAN). Comparison of an early (A–E) and an advanced (F–J) CAN case. A, Normal COX enzyme activity pattern (DT > PT) is maintained in left portion of biopsy, whereas in the right side (and higher magnification in B), hypertrophic tubules exhibit increased proximal tubular COX activity. C, Functional EM demonstrates high COX activity in proximal tubular epithelium. D, COX IV immunohistochemistry shows normal pattern of protein expression (DT > PT) in most of the biopsy; only some hypertrophic tubules on the upper right of the image have increased COX protein stain, which is in concordance with activity assay. E, MT stain shows mostly intact tubular epithelium. F and G, COX enzyme histochemistry, showing great loss of tubular COX activity; only some hypertrophic tubules exhibit COX enzyme stain. H, Functional EM shows atrophied tubule with greatly decreased mitochondrial mass and COX activity. I, COX IV protein expression is maintained in remaining tubular epithelial cells. J, MT stain shows severe interstitial fibrotic change and atrophy. Abbreviations: COX, cytochrome C oxidase; EHC, enzyme histochemistry; LM, light microscopy; DT, distal tubular; PT, proximal tubular; EM, electron microscopy; MT, Masson’s trichrome; IHC, immunohistochemistry. Scale bars: A and F = 200 µm; B, D, E, G, I, and J = 100 µm; C and H = 2µm.

