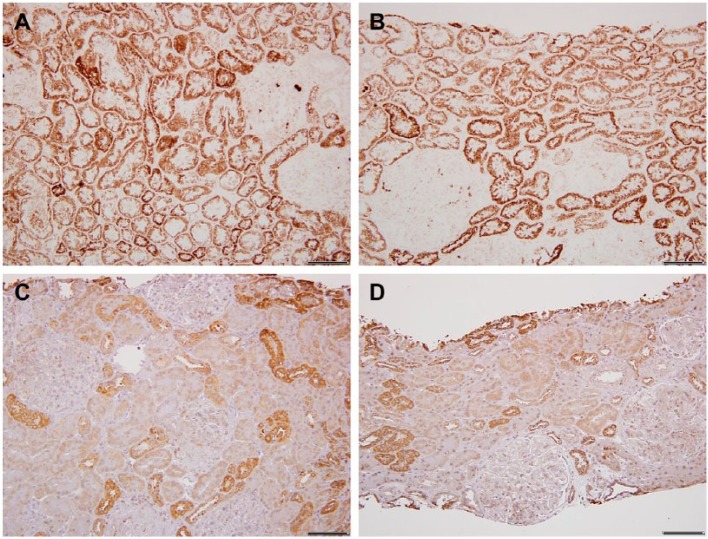
Figure 3.
Lupus erythematosus. A and B, Light microscopy images of cytochrome C oxidase (COX) enzyme histochemistry in two different lupus cases; both show uniformly increased proximal tubular COX activity. C and D, In contrast, COX immunohistochemistry reveals normal COX IV protein expression pattern, distal tubular (DT) > proximal tubular (PT). Scale bars: A–D = 100 µm.

