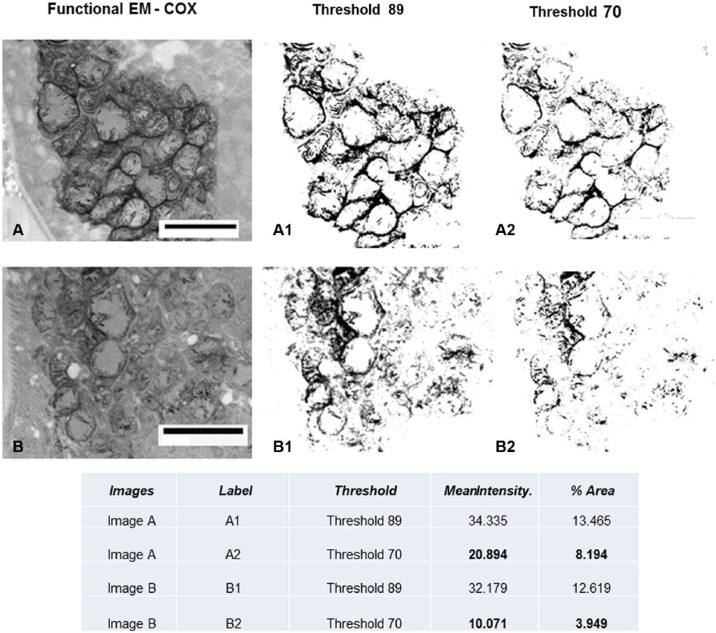
Figure 5.
Quantitative measurement of functional EM. See Fig. 4C and D for original figures. Using NIH ImageJ software, the mitochondrial mass is depicted by setting a higher threshold (threshold, 89) and the specific COX activity is depicted by setting a lower threshold (threshold, 70); mean intensity and percent area are measured per total image area. The COX activity in image B is clearly decreased compared with image A, whereas mitochondrial mass is similar in the two images. Abbreviations: COX, cytochrome C oxidase; EM, electron microscopy. Scale bars: A and B = 2.5 µm.

