
Fig. 5.
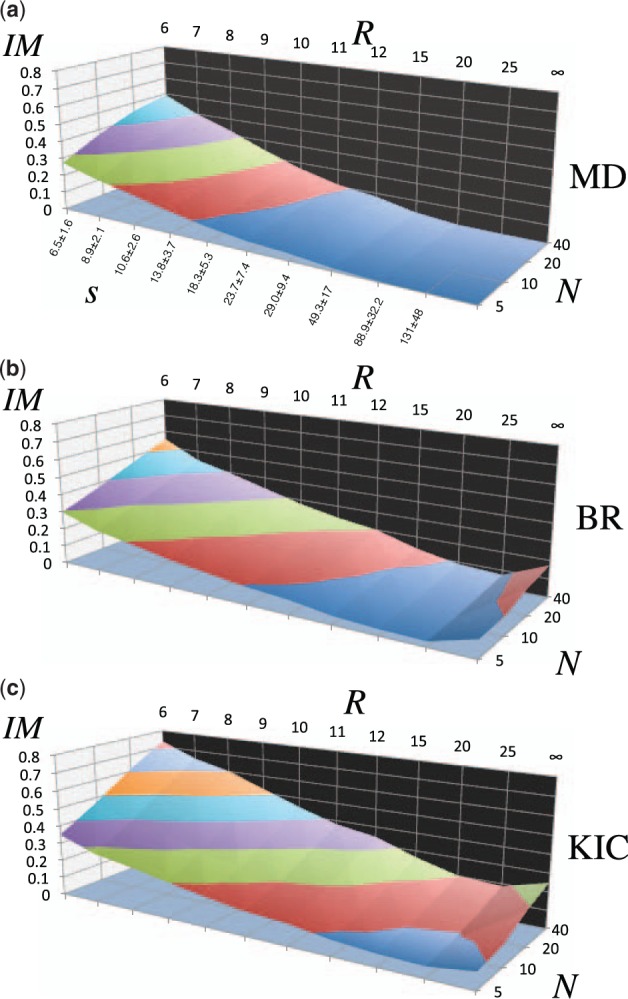
Improvement (%IM) of local substructures between the target structure and the template ensemble for a 20-member protein dataset (Table 1), averaged over 10 replicates. R is the radius of expansion that defines the local substructure and N is the number of de novo structures generated in the ensemble. s is the average number of Cα carbon atoms in the local substructure ± standard deviation is shown along the lower left in (a), for each radius R. Surfaces show the improvement for local substructures. Iso-lines illustrate the pareto front in the dimensions of N and R. (a) MD:Amber94 molecular dynamics ensembles. (b) BR: Rosetta backrub ensembles. (c) KIC: Rosetta kinematic closure ensembles