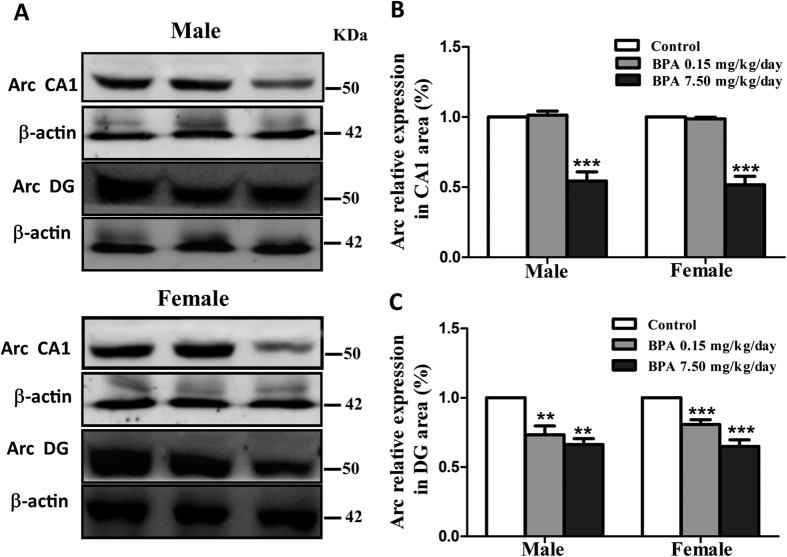
Figure 5. Effects of BPA exposure on Arc expression.
Representative immunoblot bands (A) and corresponding densitometric analysis (B/C) showing Arc protein expression in CA1 and DG region. Blot images were cropped for comparison. β-actin was used as a loading control. Arc and β-actin were run on the same blot. The optical density of bands was quantified by Image-J software. N = 6 or 7 rats per group (**p < 0.01, ***P < 0.001).

