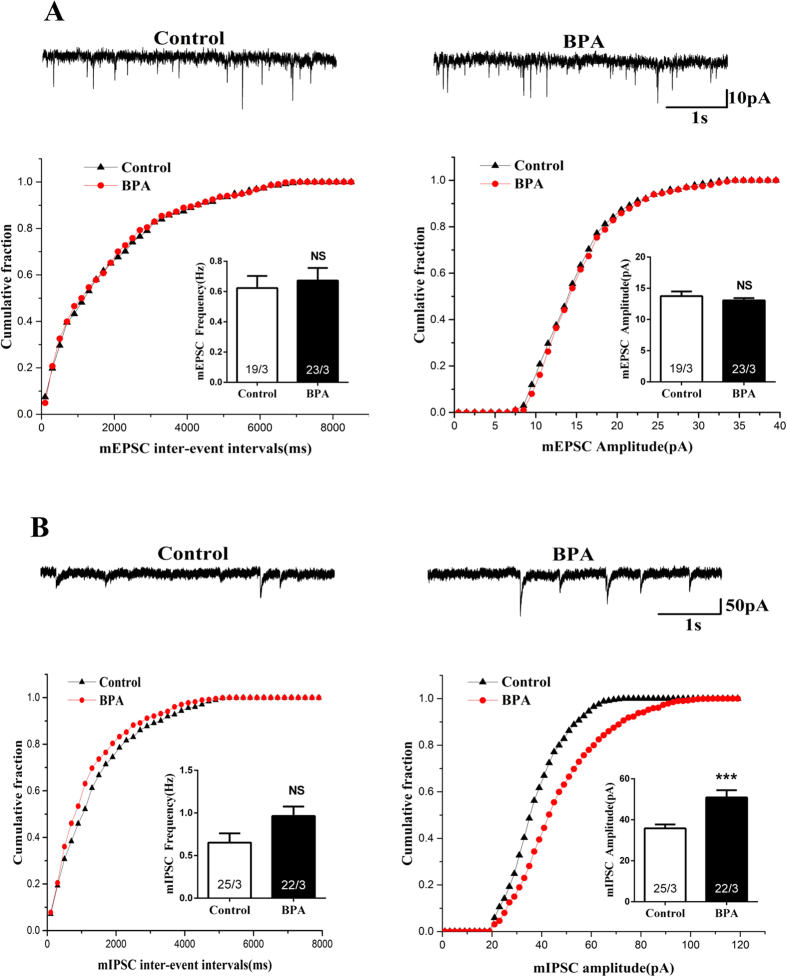
Figure 6. Effects of BPA exposure (2 h) on excitatory and inhibitory synaptic transmission in cultured hippocampal CA1 neurons.
(A) Representative mEPSC traces and quantification of amplitude and frequency of mEPSC. (B) Representative mIPSC traces and quantification of amplitude and frequency of mIPSCs (***p < 0.001). The ‘x’ of ‘x/3’ in the picture represents the number of neurons used from three independent cultures.

