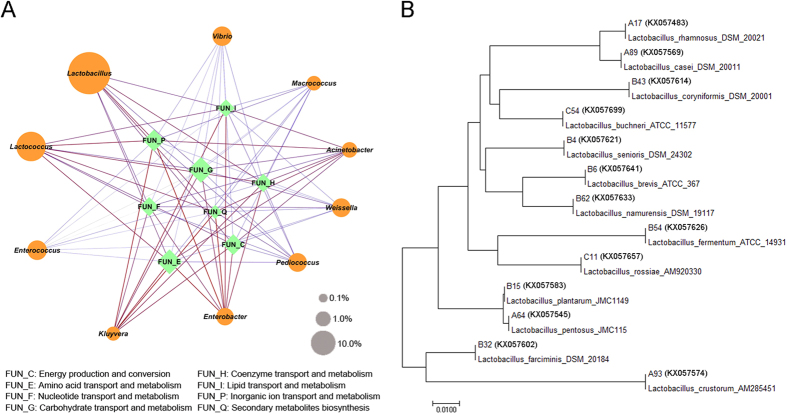
Figure 5.
(A) Concordance of core microbiota and metabolic functional features. The edge width and color (red: positive and blue: negative) are proportional to the correlation strength. The node size is proportional to the mean abundance in the respective population. (B) Phylogenetic tree based on 16S rRNA gene sequences of Lactobacillus isolates.

