Figure 9.
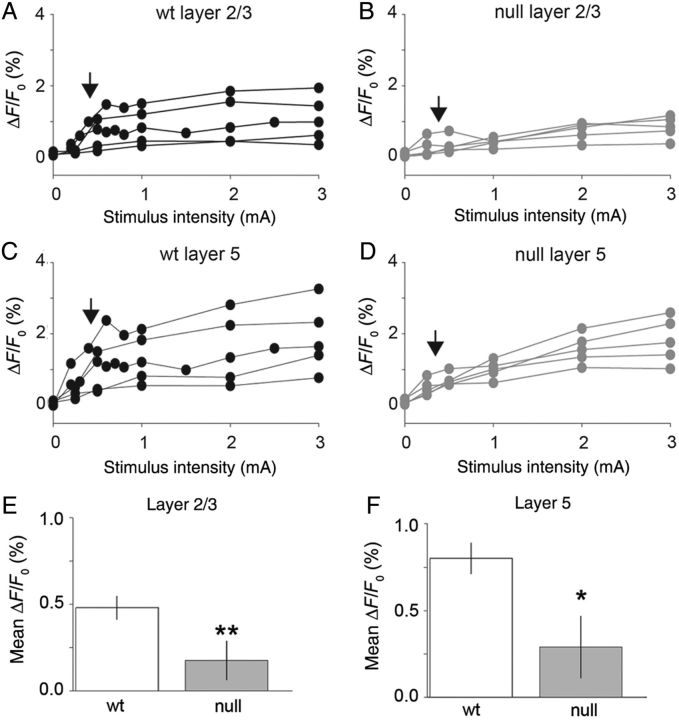
Mecp2 null mPFC brain slices display reduced calcium responses to evoked stimulation compared with Wt. (A–D) Calcium responses are shown as a function of stimulus current pulse intensity (mA) for the population of brain slices examined for Mecp2 null (black lines, n = 5) and Wt (gray lines, n = 5) animals. Vertical arrows indicate the threshold level stimulus for a significant change in response level. (E) Summary of responses (ΔF/F0) measured in layer 2/3 using Fluo-4AM calcium imaging of mPFC in Mecp2 null versus Wt mice. There is a significant reduction in the threshold level responses in Mecp2 null versus Wt. brain slices (mean, null = 0.18% and Wt = 0.48%; P = 0.02, two-tailed Student's t-test). (F) Layer 5 estimates of calcium response to electrical stimulation are also reduced in Mecp2 null slices compared with Wt (mean null = 0.29% and Wt = 0.80%; P = 0.04, two-tailed Student's t-test).

