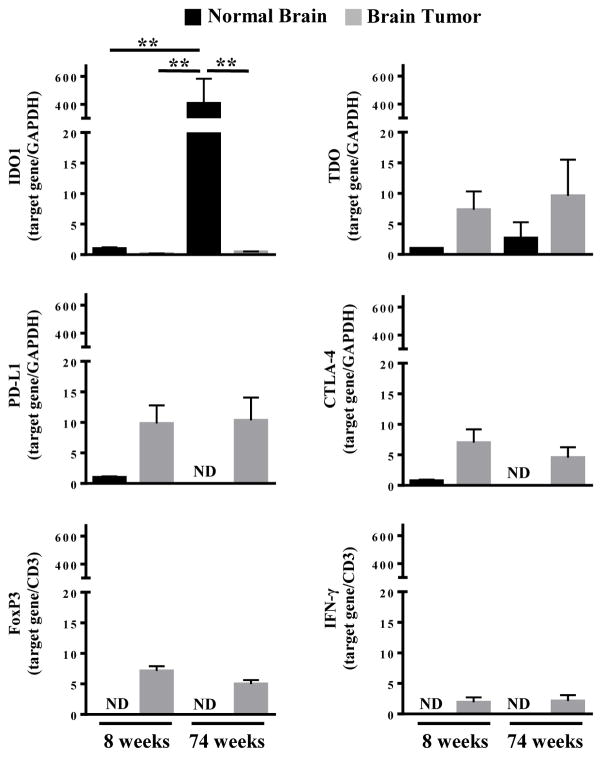
Figure 2. mRNA expression analysis for immunoregulatory genes in young and old mice with brain tumors.
RT-PCR quantitative analysis for IDO1, TDO, PD-L1, CTLA-4, FoxP3, and IFN-γ in GL261 cell-based glioma lysates isolated at 3 weeks post-intracranial engraftment in 8 week old (n=8) and 74 week old (n=5) WT mice. ND = Not detectable. Bar graphs shown as mean ± SEM. Significance determined by One-Way ANOVA followed by a Turkey’s post-hoc test (P<0.01).

